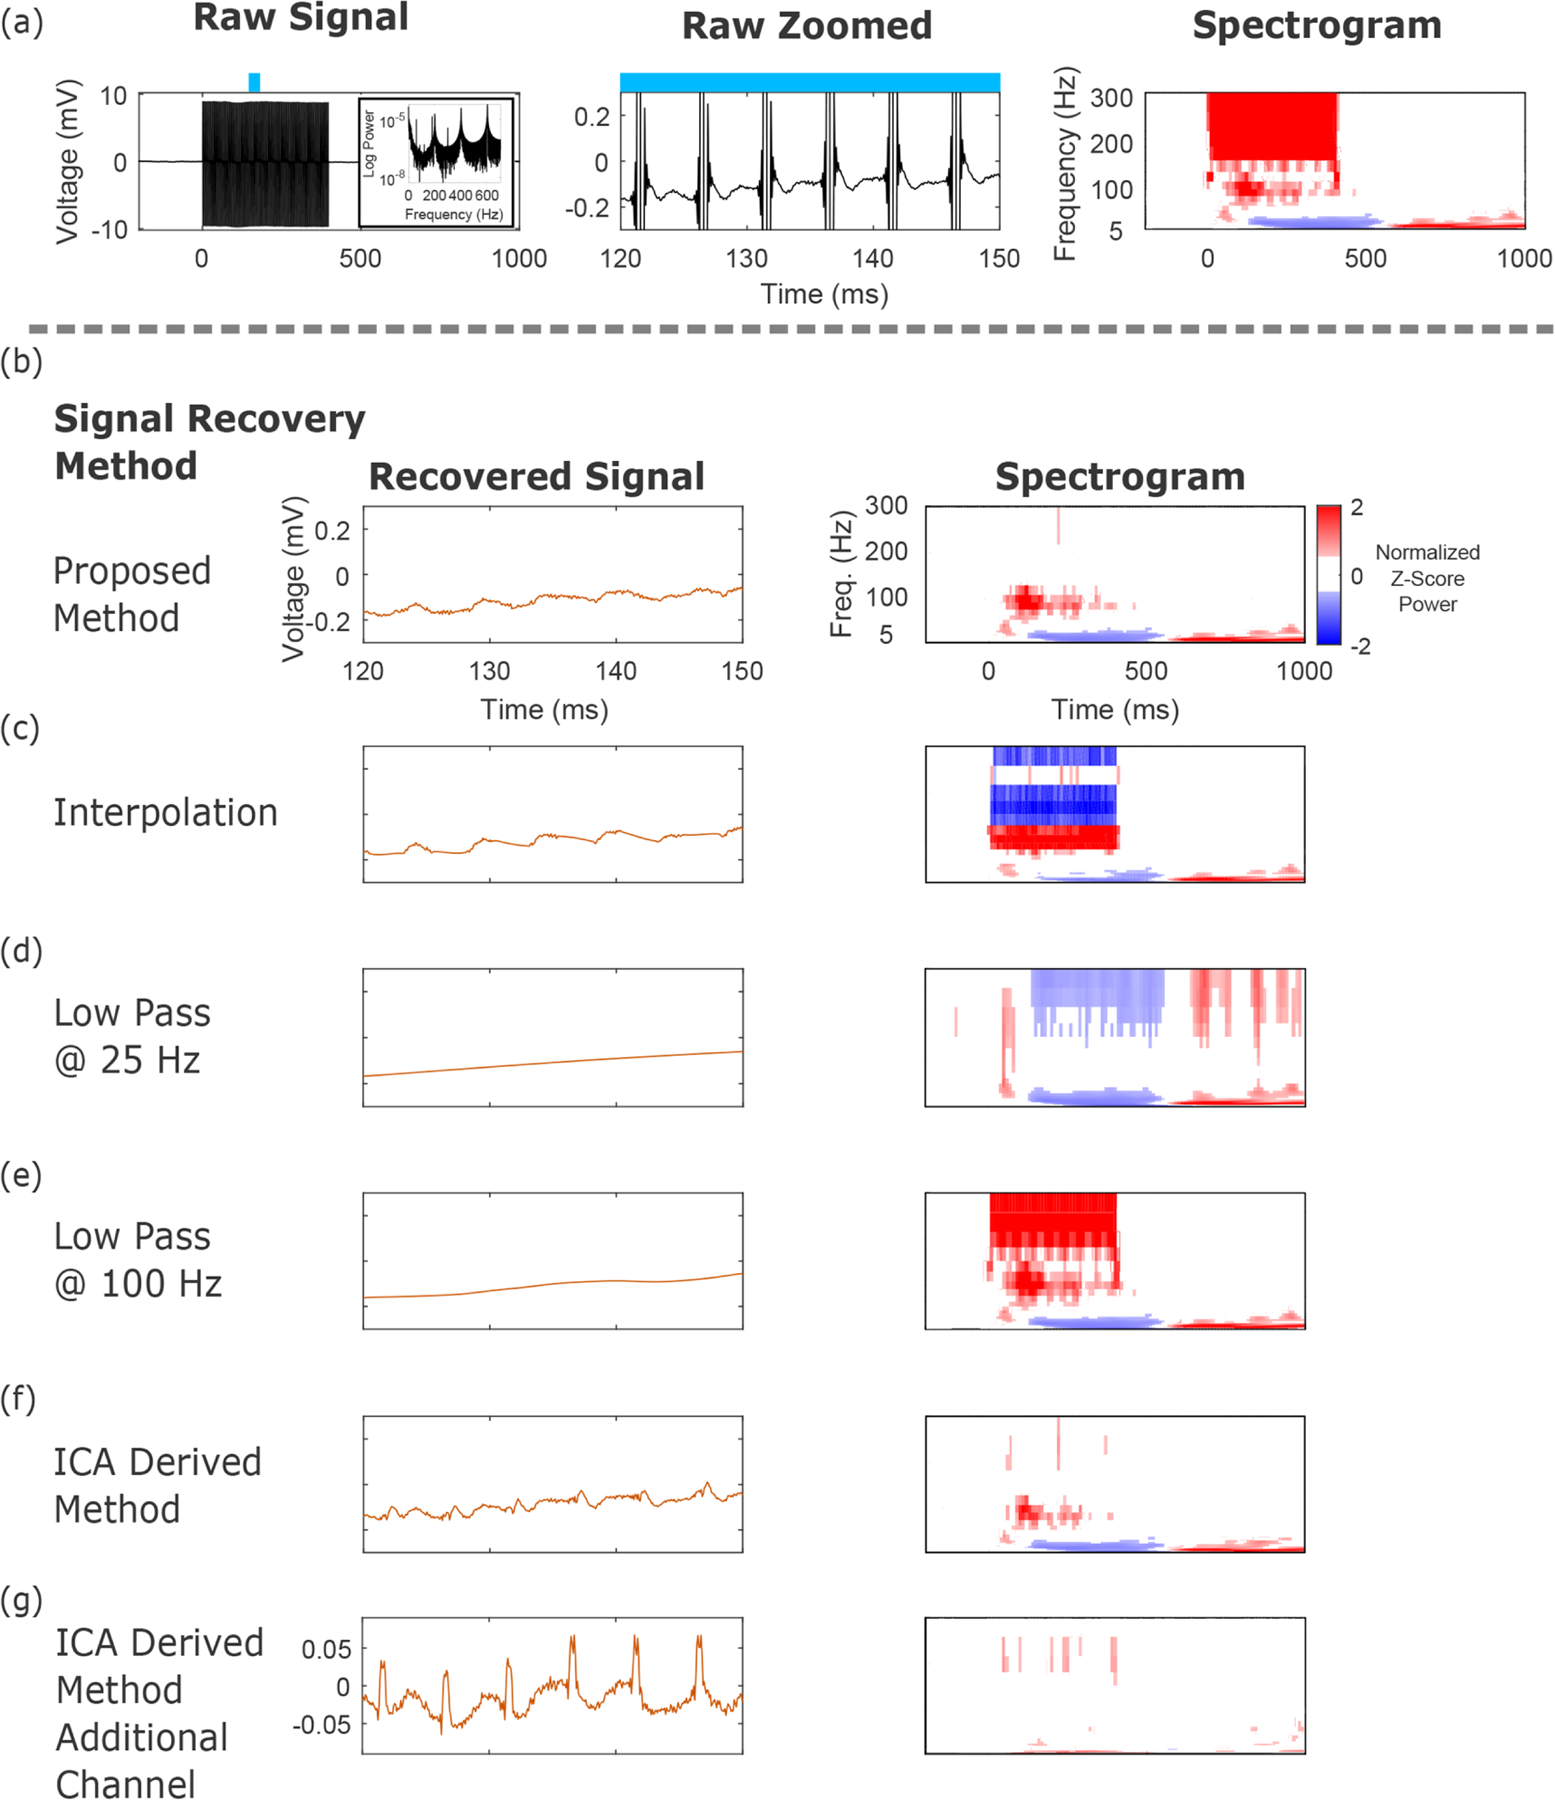
Figure 3.

Comparisons between artifact rejection with our dictionary learning method and alternative methods as illustrated with a single channel. (a) Average raw stimulation signal across trials, from concurrent stimulation and recording. The broad spectral nature of these artifacts reveals significant overlap between spectral features of interest and the stimulation frequency. The time-frequency plot illustrates the broad spectral nature of the stimulation artifacts during the train of stimulation pulses, as well as onset and offset artifacts. (b) Signal recovery by our method has leveraged the data to account for variable artifacts in the raw voltage and timing across different channels. Our approach captures both time-series and time-frequency information (here shown averaged across all trials) well. (c) Piece-wise cubic spline interpolation locally reduces the time-domain artifact, but the time-frequency plot illustrates how large, undesirable signals have been introduced, highlighting how similar time-series traces can have significantly different spectral content. (d) Low pass filtering at 25 Hz with a 4th order acausal Butterworth filter eliminates the high frequency artifact at 200 Hz, but flattens the time-series signal and eliminates the 100 Hz activity recovered in panel (b). (e) Low pass filtering at 100 Hz fails to eliminate the high frequency artifact at 200 Hz, and flattens the time-series signal. (f) An ICA derived method that selectively removes components with a dominant 200 Hz spectral component removes the 200 Hz artifact, but also attenuates the time-varying spectral information in panel (b). (g) The same ICA derived method results in incomplete signal separation on other channels within the array, leaving large residual artifacts.
