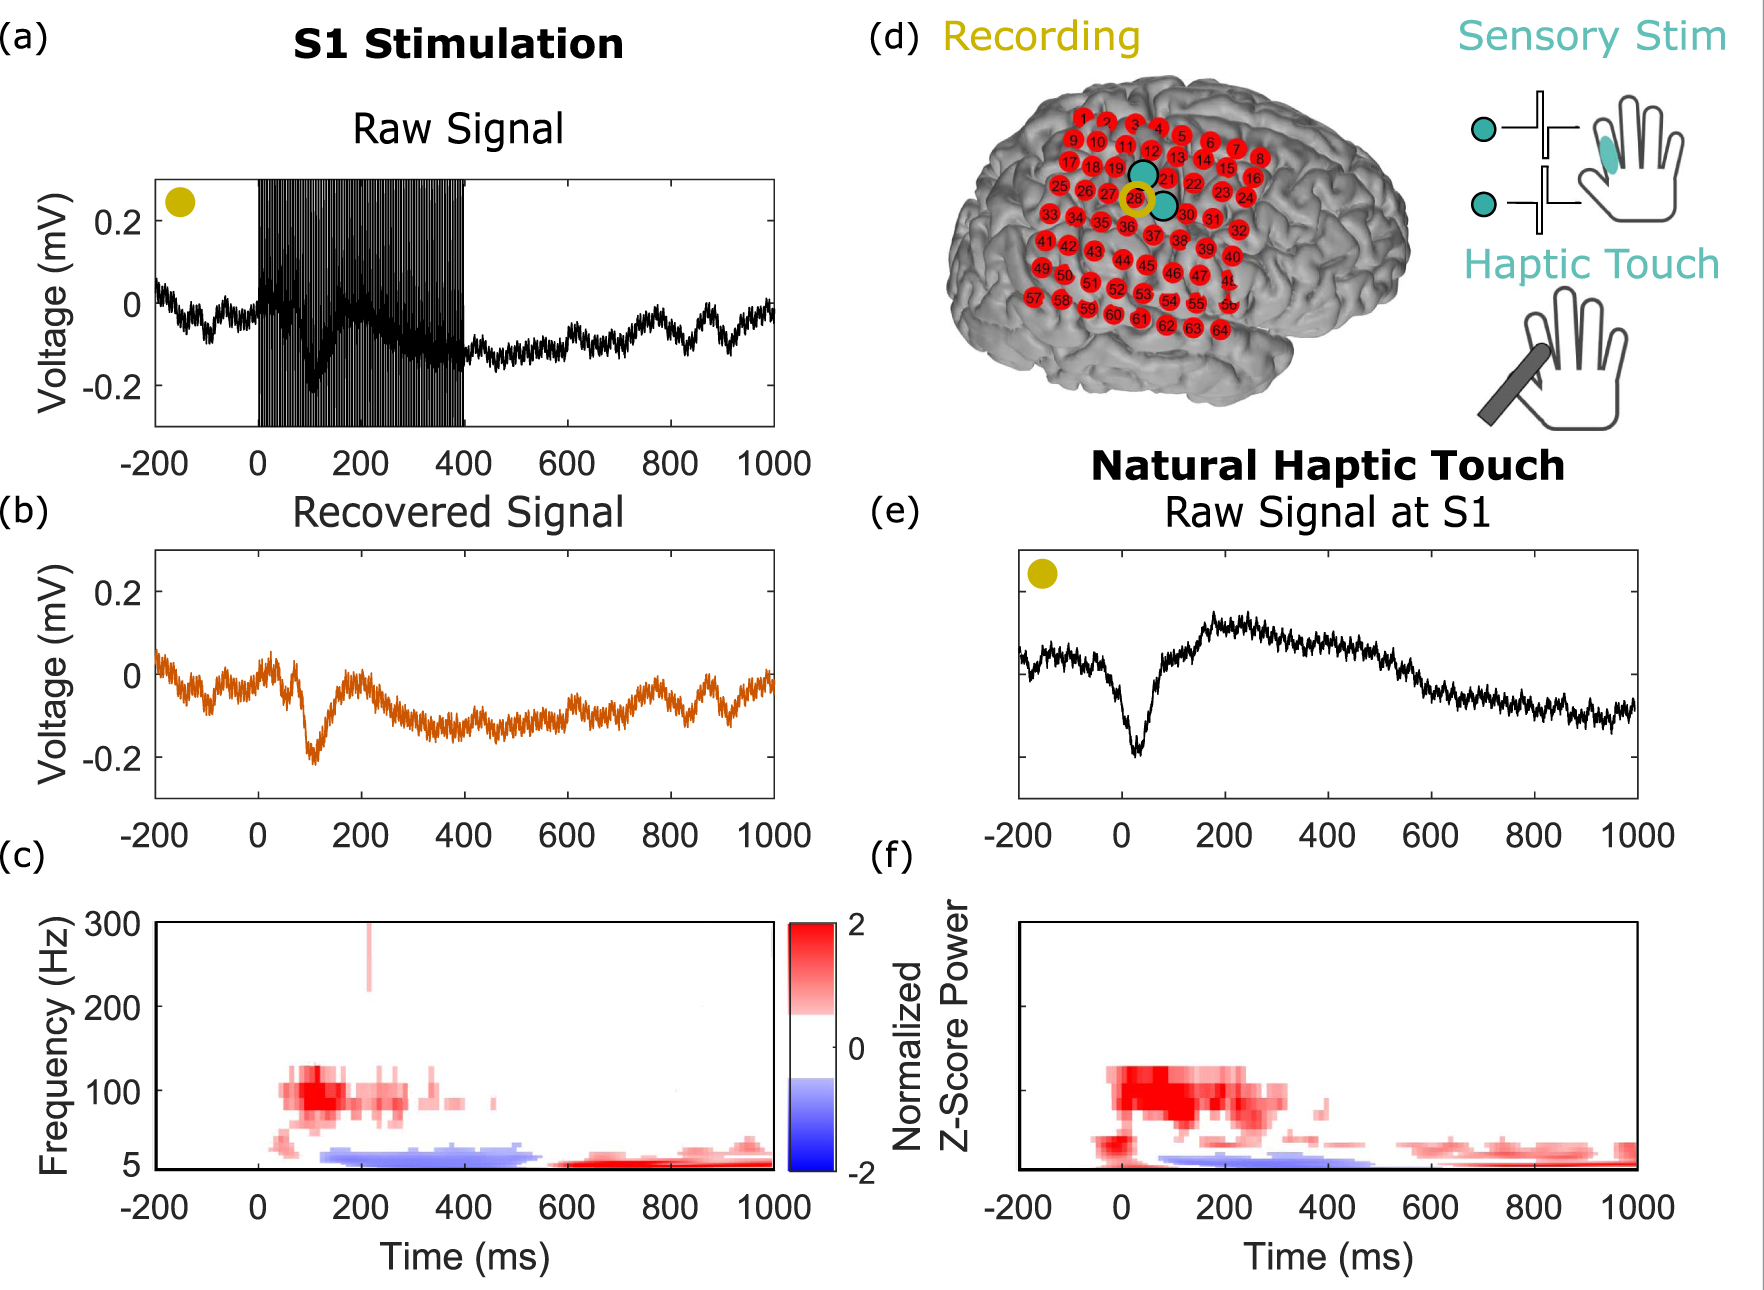
Figure 5.

Signal recovery shows meaningful neural activity after artifact subtraction in a comparison of electrical stimulation with peripheral haptic touch. We compared responses at an electrode (yellow circle) that showed robust responses to both haptic and direct S1 stimulation. The site of the touch was matched to where the stimulation sensation was localized on the hand, as illustrated in (d). (a) The raw time-series trace, averaged over all stimulation epochs, aligned on stimulation train onset at time t = 0 ms, showing prominent stimulation artifacts (a train of pulses at 200 Hz applied for 400 ms). (b) The average of the recovered signal. (c) The time-frequency plot of the signal in panel (b). (d) The experimental paradigm. (e) and (f) The mean time-series and time-frequency plots of the haptic touch experiment aligned on touch onset, which occurs at time t = 0 ms. The small delay seen between the neural signals and t = 0, where touch onset is marked to occur, is due to previously published latencies resulting from custom electronic touch probes comprised of force-sensitive resistors (Caldwell et al 2019, Collins et al 2017).
