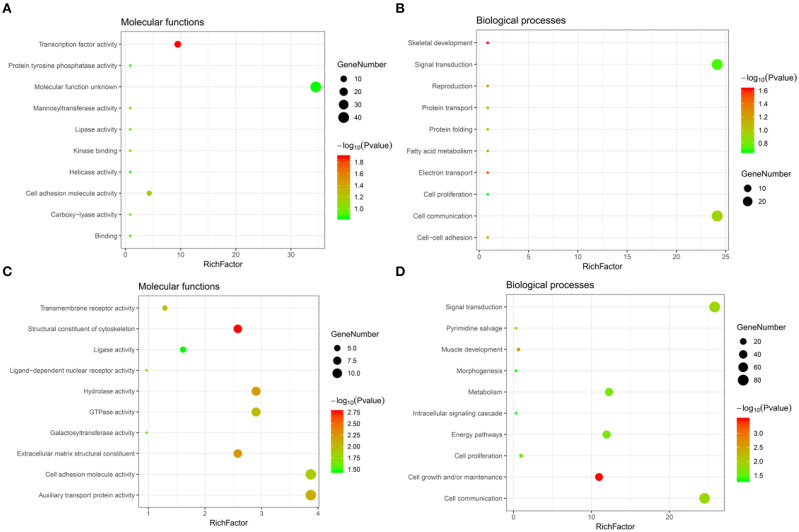
Figure 4.
GO annotations analysis of the intersecting genes. (A,B) Top 10 elements significantly enriched in the GO categories by intersecting genes of downregulated genes after CORO2A silencing and genes positively correlated with CORO2A expression: (A) molecular functions, (B) biological processes. (C,D) Top 10 elements significantly enriched in the GO categories by intersecting genes of upregulated genes after CORO2A silencing and genes negatively correlated with CORO2A expression: (C) molecular functions, (D) biological processes. Significantly enriched elements are indicated in Y-axis. Rich factor in the X-axis represents the enrichment levels. The larger value of Rich factor represents the higher level of enrichment. The color of the dot stands for the different P-value and the size of the dot reflects the number of target genes enriched.

