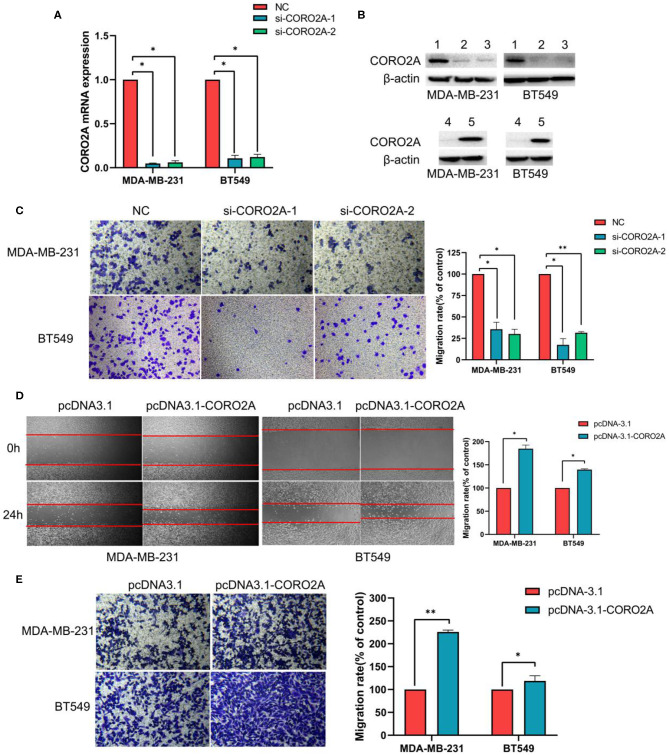
Figure 7.
Effect of CORO2A on cell migration in TNBC cell lines. (A) After transfection with CORO2A siRNA for 72 h, the mRNA expression level of CORO2A was assessed by RT-qPCR in MDA-MB-231 and BT549 cells. (B) After transfection with CORO2A siRNA or plasmid for 72 h, the protein expression level of CORO2A was assessed by Western blotting in MDA-MB-231 and BT549 cells. Lanes in Western blotting are denoted as: lane 1—NC, lane 2—si-CORO2A-1, lane 3—si-CORO2A-2, lane 4—pcDNA-3.1, and lanes 5—pcDNA-3.1-CORO2A. (C) Representative images of cell migration assays and the mean ± SEM (n = 3) of three independent experiments of quantitative cell migration assays in MDA-MB-231 and BT549 cells are shown following CORO2A knockdown. Cell migration measured by scratch-wound (D) and Transwell asssay (E) are shown following CORO2A overexpression in MDA-MB-231 and BT549 cells. *P < 0.05, and **P < 0.01 compared to corresponding negative controls (NC) or pcDNA-3.1.

