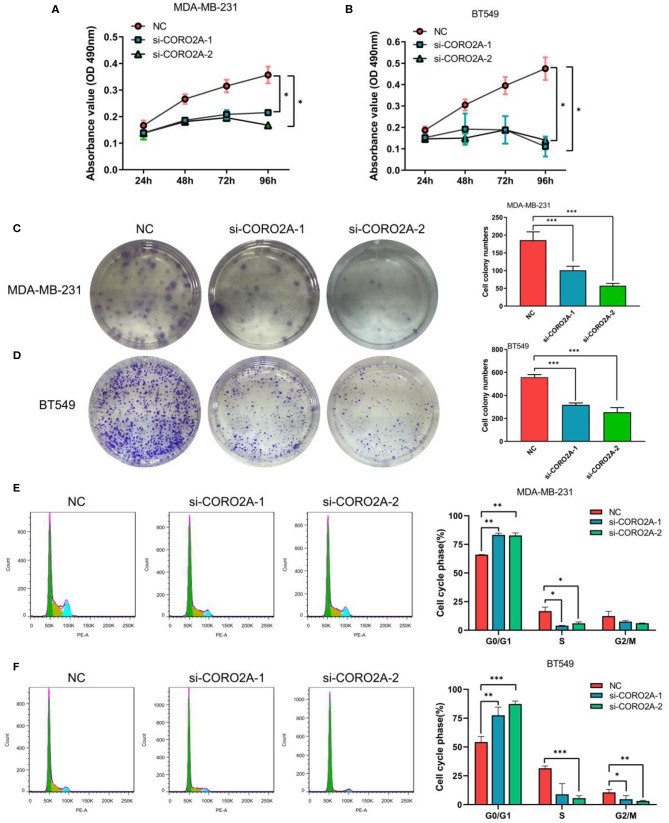
Figure 8.
Effect of CORO2A knockdown on cell growth was evaluated by MTS, colony formation, and cell cycle distribution assays in TNBC cell lines. (A,B) CORO2A knockdown inhibited the cell viability of MDA-MB-231 and BT549 cells. Cell viability was measured using MTS assay and the data are mean ± SEM (n = 3) of three independent experiments. (C,D) Representative images of colony formation assay and the mean ± SEM (n = 3) of three independent experiments of quantitative colony formation assays in MDA-MB-231 (C) and BT549 (D) cells are shown following CORO2A knockdown. (E,F) Representative images of cell cycle distribution and the mean ± SEM (n = 3) of three independent experiments of quantitative cell cycle distribution in MDA-MB-231 (E) and BT549 (F) cells are shown following CORO2A knockdown. *P < 0.05, **P < 0.01, and ***P < 0.001 compared to corresponding negative controls (NC).

