
FIGURE 3.
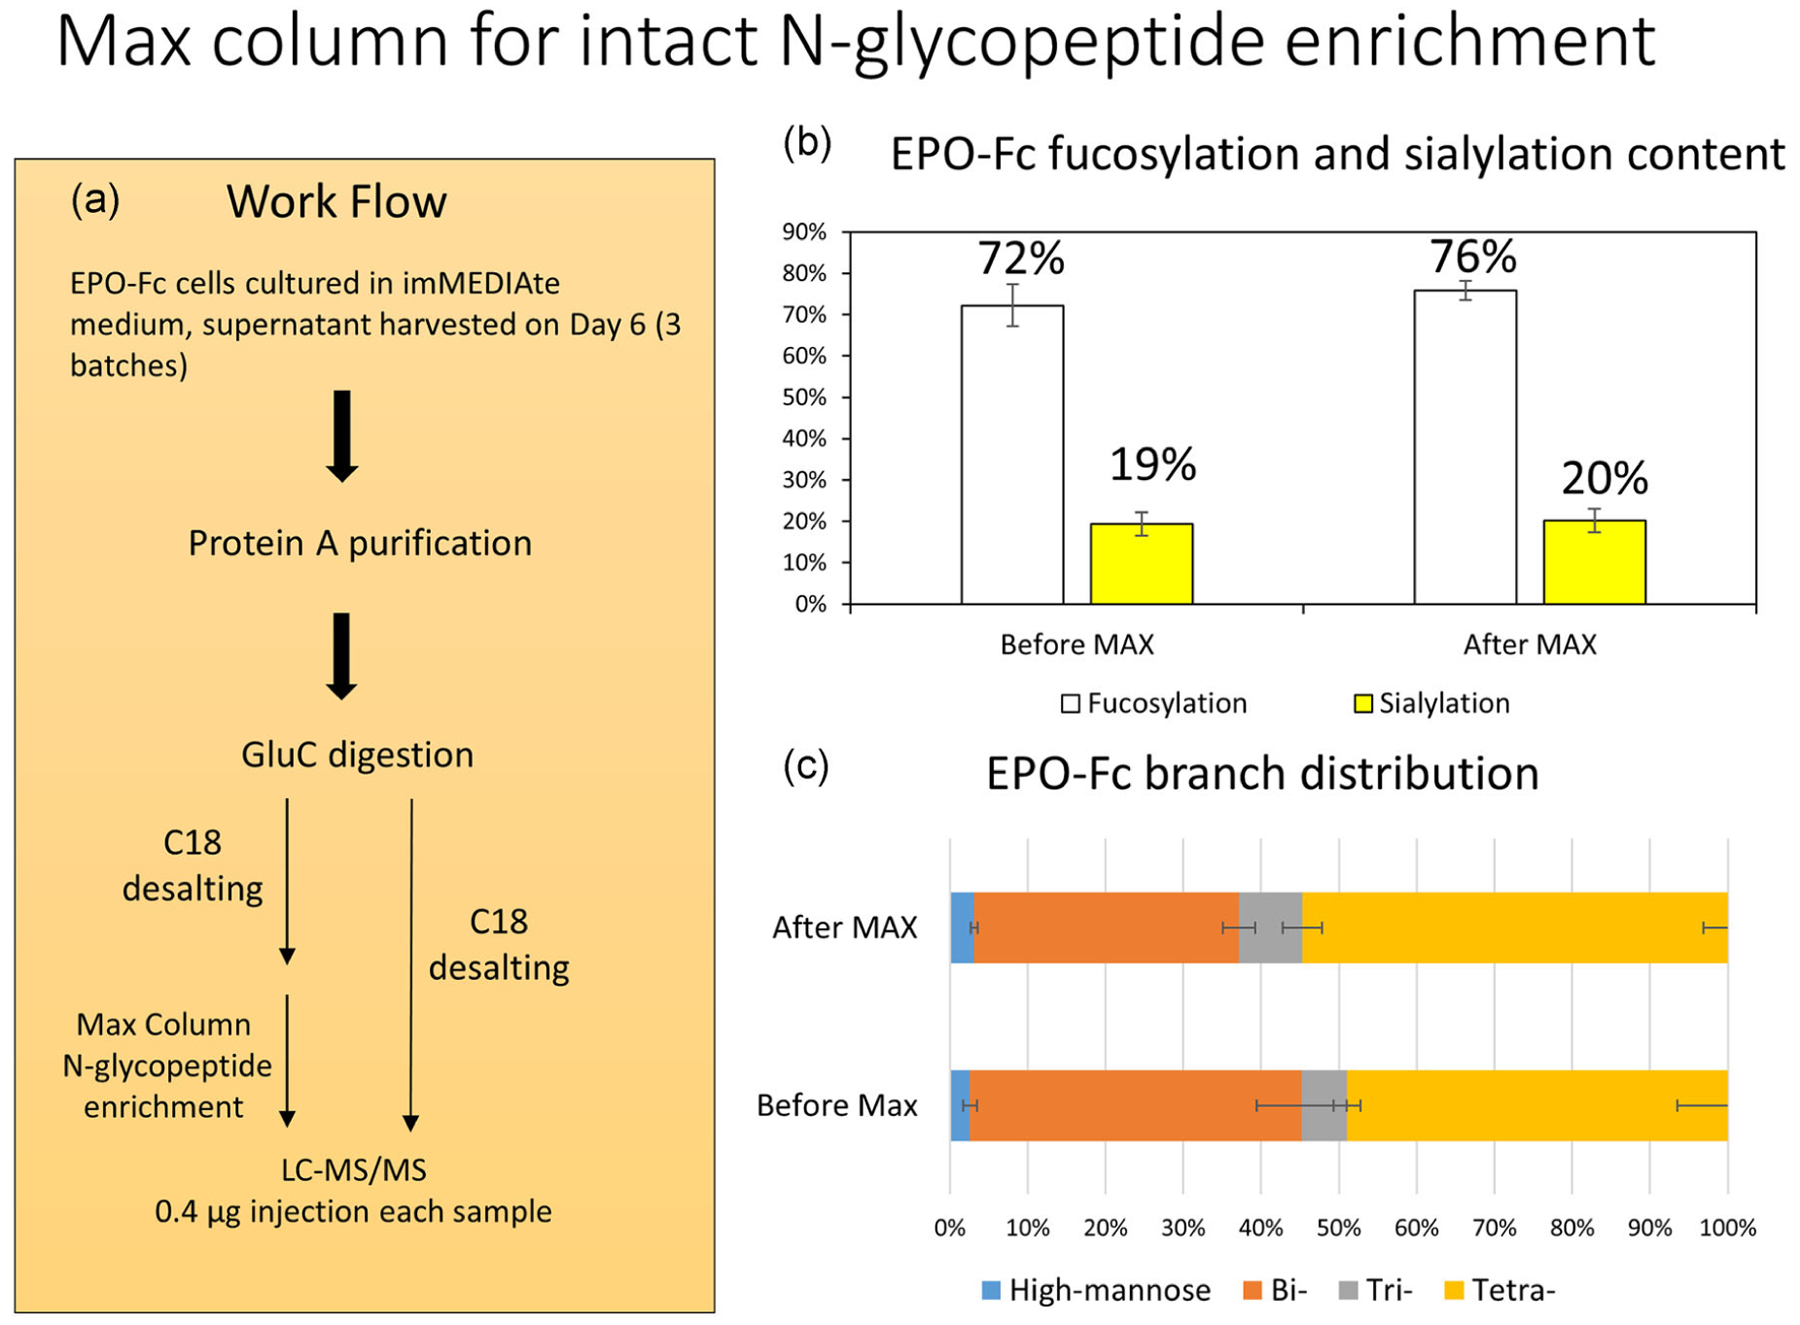
The application of MAX column for N-glycopeptide enrichment. (a) The workflow of MAX column comparison study. (b) The EPO-Fc fucosylation and sialylation content before and after MAX column enrichment. (c) The EPO-Fc N-glycan branch distribution before and after MAX enrichment. The p-values for high-mannose, bi-, tri-, and tetra-antennary glycan types before and after MAX column enrichment is 0.5, 0.12, 0.35, and 0.32, respectively. EPO, erythropoietin; MAX, mixed anion exchange