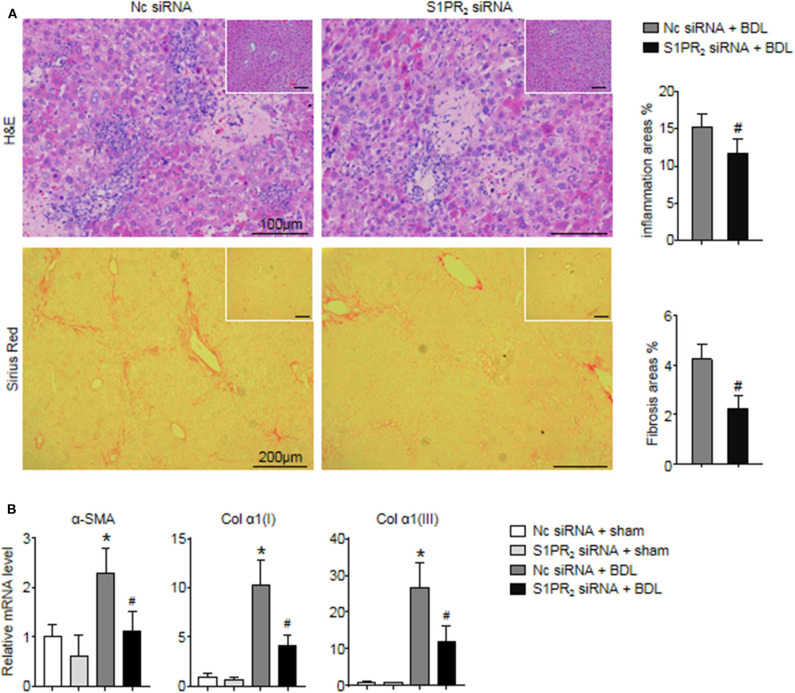
Figure 8.
Effects of macrophage-selective siRNA knockdown of S1PR2 in BDL-injured livers. (A) Representative H&E and Sirius Red staining and quantitative analysis in mouse livers at 2 weeks after BDL operation. Inset: H&E and Sirius Red staining in sham-treated livers. (B) Relative mRNA levels of hepatic α-SMA, Col α1(I), and Col α1(III) in mouse livers at 2 weeks after BDL operation. Data are presented as the mean ± SEM. n = 6 per group. Student's t-test was used in panel (A) and two-way ANOVA was used in panel (B). *p < 0.05 vs. sham group; #p < 0.05 vs. BDL-treated alone.

