Fig. 3.

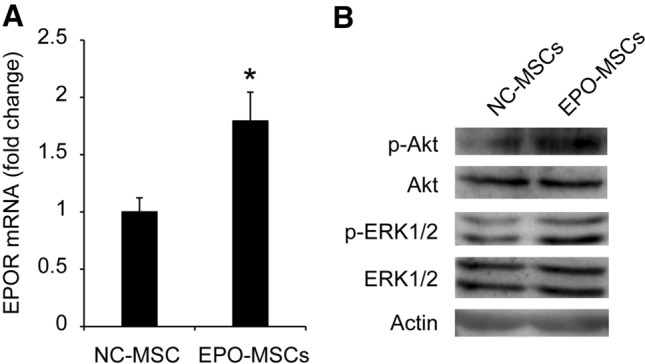
The intracellular signaling cascades induced by EPO overexpression in MSCs. A Quantitative PCR was performed to quantify EPOR mRNA expression. Values are normalized with β-actin mRNA and expressed as a percentage of the control value, as the normalized expression of BM-MSCs infected with negative control (NC). Data represent mean ± SEM from three independent experiments. *p < 0.05. B EPO overexpression on phosphorylation of Akt and ERK1/2 detected by western blot
