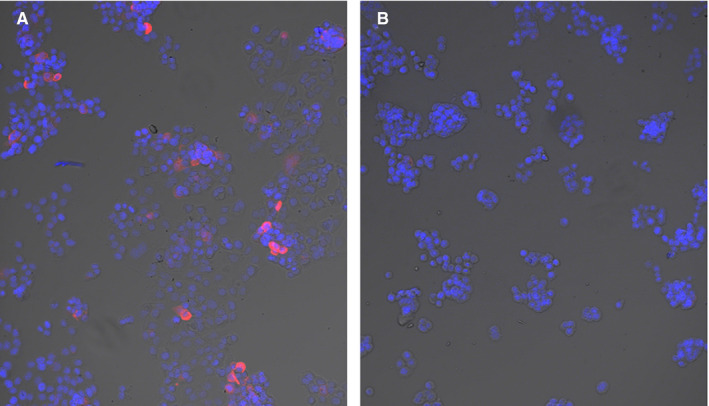
FIGURE 2.

TAG72 expression in OVCAR3 cells using confocal microscopy. OVCAR3 (A) or HT‐29 (B) cells were stained with the CC49 antibody followed by fluorescent labeled rabbit anti‐mouse antibody (red) and DAPI (blue). HT‐29 cells were used as a negative control. Magnification 10x
