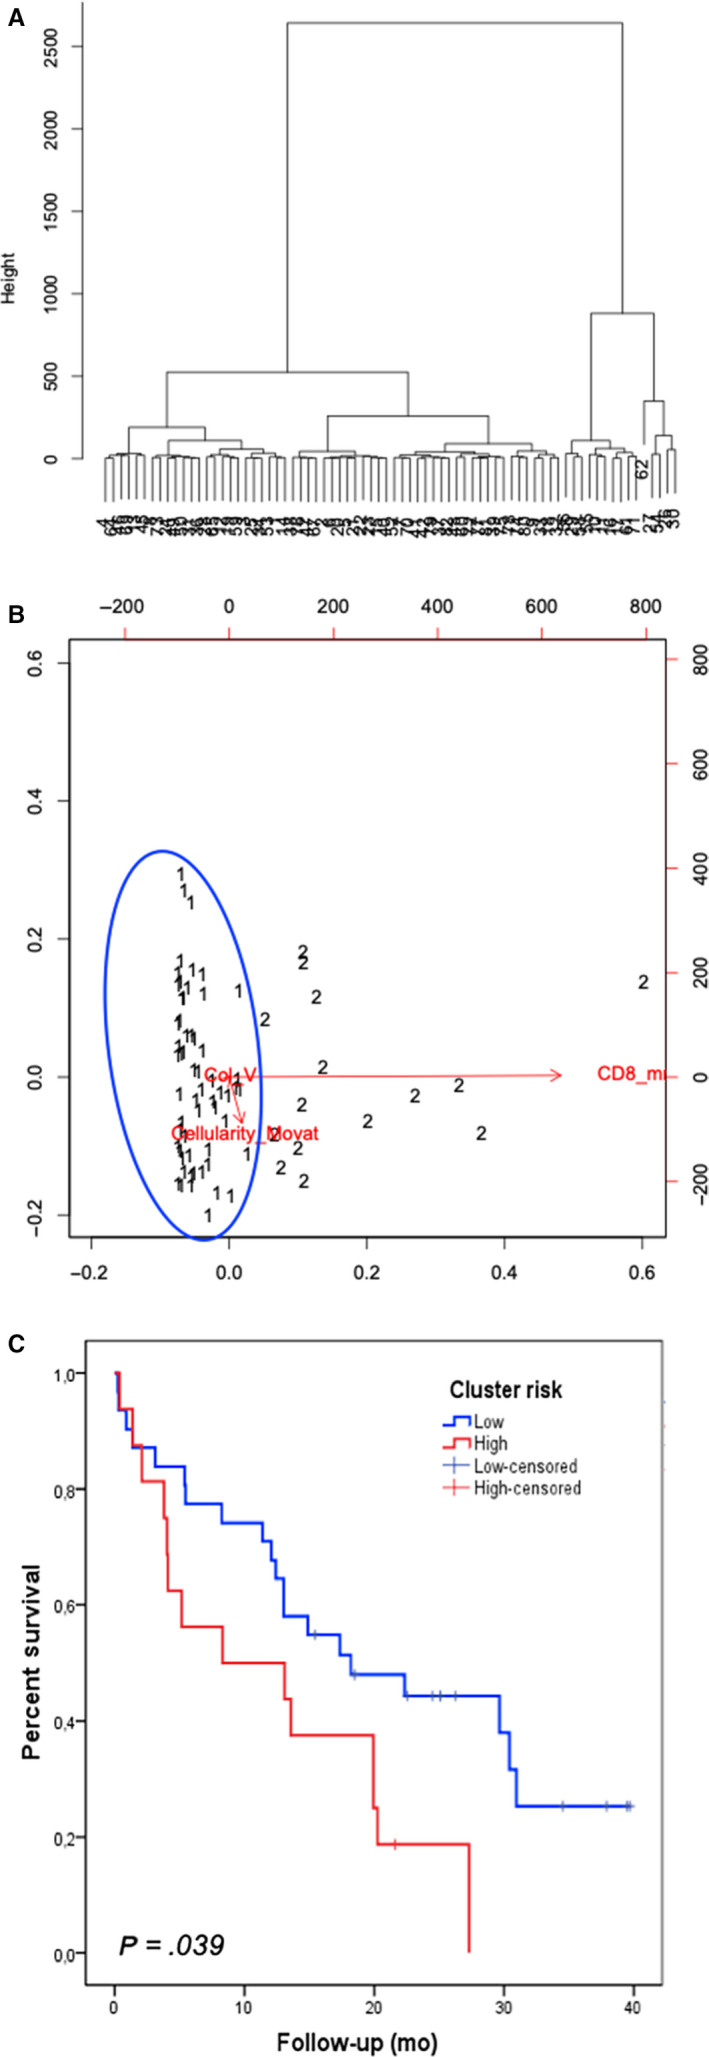
Figure 5.

A, Dendrogram illustrating the arrangement of the clusters produced by the corresponding analyses of hierarchical clustering analysis of the studied 82 MM patients. Patients split into two clusters, which are separated by vertical lines. For markers, vertical lines on the left indicate low (below cutoff) expression or cellularity < 80.6 cells/mm2 CD4/CD8, collagen V < 7.75 fibers/mm3, and CD8 > 99.77 cells/mm2, whereas vertical lines on the right indicate high (above cutoff) expression or cellularity > 80.6 cells/mm2 CD4/CD8, collagen V > 7.75 fibers/mm3, and CD8 < 99.77 cells/mm2. Only significant (P < .05) discriminating markers or marker groups are annotated. B, Dispersion graph illustrates the grouping distribution of cases by the clustering model showing two risk groups: a distinct low‐risk cluster (grouping 1, blue circle) and a high‐risk cluster (grouping 2). C, Survival analysis of MM clusters. Note the poorer outcome of MM cluster 2 (linked to high expression of cellularity > 80.6 cells/mm2 CD4/CD8, higher expression of collagen V > 7.75 fibers/mm3, and lower expression of CD8 < 99.77 cells/mm2 compared with cluster 1; P = .039 (for comparison between all two clusters). MM indicates malignant mesothelioma; CD8 indicates cytotoxic lymphocytes
