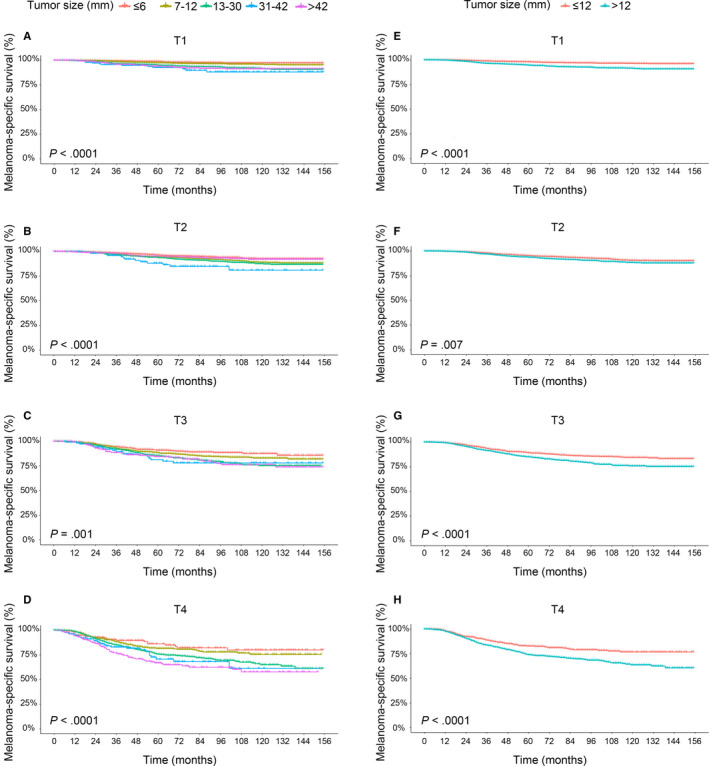
FIGURE 2.

Survival analysis. Kaplan‐Meier curves are shown for melanoma‐specific survival in five tumor size subgroups (≤6, 7‐12, 13‐30, 31‐42, and >42 mm) (A, B, C, D) and two tumor size subgroups (≤12 and >12 mm) (E, F, G, H) of patients with localized primary cutaneous melanoma in each T category (n = 21,361). P value illustrates the difference between these curves, as calculated with the log‐rank test
