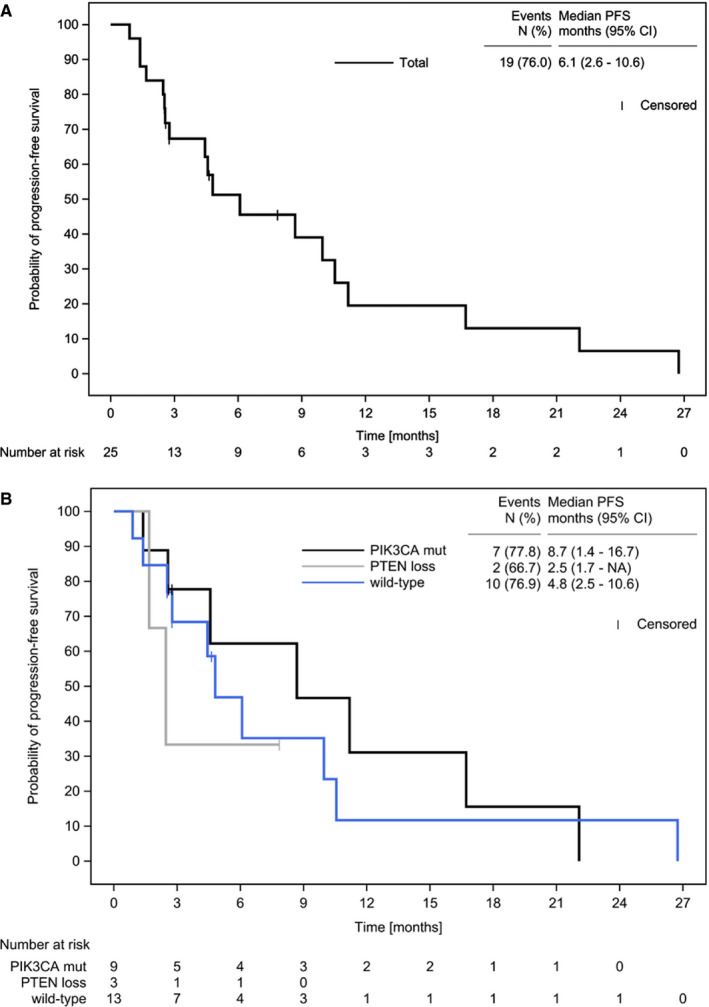
FIGURE 2.

Kaplan‐Meier Estimate of Progression‐Free Survival. Displayed are progression‐free survival in the total patient population (A) and in the prespecified subgroups: PIK3CA mut = “PIK3CA mut/ PTEN preserved”; PTEN loss = “PIK3CA mut or wt/ PTEN loss”; wild‐type = “PIK3CA wt/ PTEN preserved” (B) in the SAF population. Abbreviations: CI, confidence interval; n, number (of events); NA, not reached; PFS, progression‐free survival
