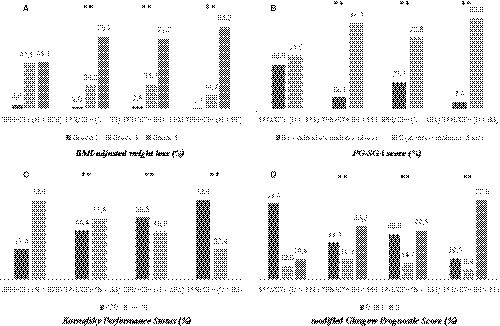
Figure 2.

Differences in patient distribution (%) for the four groups identified (by the type of parenteral nutrition and whether they received chemotherapy during the study period). Differences are according to (a) BMI‐adjusted weight loss categories, (b) Patient‐Generated Subjective Global Assessment (PG‐SGA) score, (c) Karnofsky Performance Status, and (d) modified Glasgow Prognostic Score. ** P < .01 (SPN/CT + was the reference group when compared with TPN/CT+; SPN/CT‐; TPN/CT‐).SPN: supplemental parenteral nutrition; TPN: total parenteral nutrition; CT+: chemotherapy received; CT‐: no chemotherapy received; BMI: body mass index
