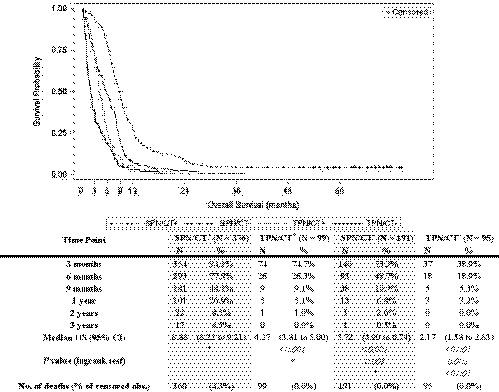
Figure 3.

Overall survival. Overall survival (in months) since home parenteral nutrition start reported as Kaplan‐Meier curves that identify the different cohorts; percent of patients alive at different time‐points; median survival and 95% CI. * Reference group for the log‐rank test. SPN: supplemental parenteral nutrition; TPN: total parenteral nutrition; CT+: chemotherapy received; CT‐: no chemotherapy received; CI: confidence interval
