Figure 3.
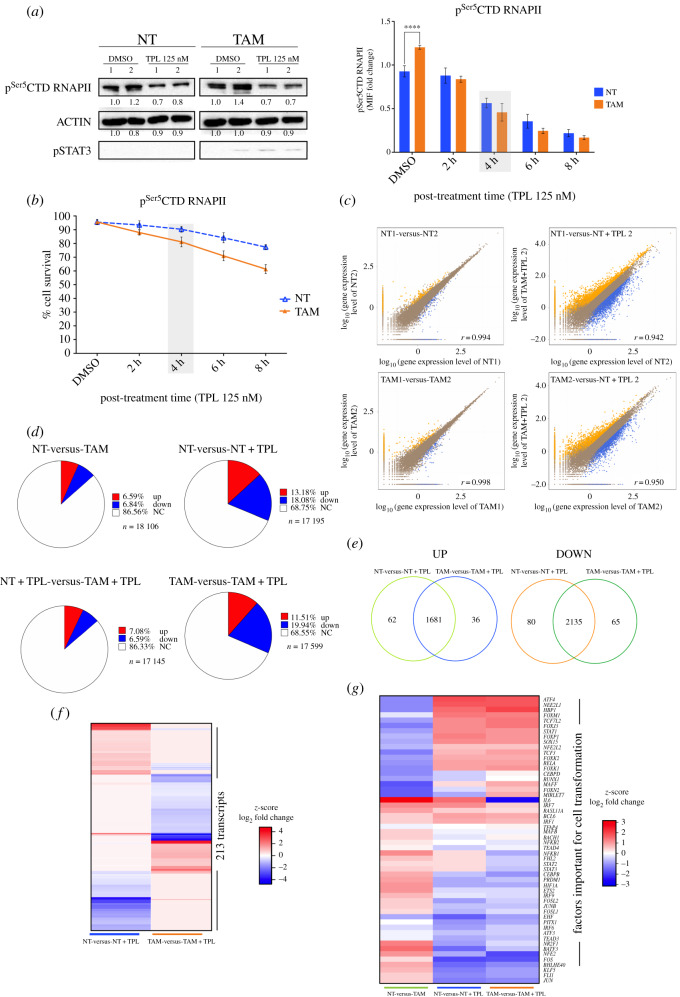
Transcriptome analysis of TPL-treated cells. (a) Left panel show western blots (WB) to evaluate the pSer5CTD RNAPII in tamoxifen non-treated (NT) and tamoxifen-treated (TAM) cells incubated with triptolide (TPL) for 4 h at 125 nM or DMSO for 4 h as a control. Densitometric analyses were performed using actin as a loading control. The relative quantification is indicated under each blot from two biological replicates. pSTAT3 is used as a transformation control. The cells were collected and divided into two fractions, one for WB and the other for RNA-Seq analysis. The right panel indicates the quantification of pSer5CTD RNAPII by flow cytometry, NT (blue) and TAM cells (orange), the grey box, indicates the time that pSer5CTD RNAPII has decreased approximately 50%. (b) Cell viability of the NT (blue) and TAM cells (orange) incubated with 125 nM of TPL for 2, 4, 6 and 8 h. DMSO (incubated for 8 h) was used as control. It can be appreciated that at 4 h (grey box) the cell viability is not very compromised. (c) Pearson's correlation between two of the replicas of the RNA-Seq data (left) and between two samples (right); the x- and y-axes represent the log10 value of gene expression. The blue dots represent the downregulation transcripts; orange dots upregulation transcripts and brown dots non-affected. (d) Percentages of up and downregulated genes in NT, NT cells incubated with triptolide for 4 h at 125 nM (NT + TPL), TAM cells and TAM cells incubated with triptolide for 4 h at 125 nM (TAM + TPL). In red are represented the transcript percentages that increased, in blue the transcript percentages that are down and in white the transcripts with no significant log2 fold change. (e) Venn diagram showing the percentage of up and down, unique and common transcripts between NT and TAM cells treated TPL. (f) Heat map comparing 213 transcripts that are differentially expressed between NT and TAM cells after TPL treatment. (g) Heat map showing the response to TPL in the expression of genes that are either up or downregulated in the establishment of the transformed phenotype. Note that TPL induces the increase in expression of most of the genes downregulated for the transformed phenotype and reduces the expression of most of the genes upregulated to maintain the transformed phenotype. Right panel (a) and graph (b) represent three biological replicates while left panel (a) and graphs (c) to (g) summarizing the results of two biological replicates. In graph (a-right) and (b) data are mean ± s.d. (standard deviation). Significant differences were analysed by Two-way ANOVA with corrections for multiple comparisons. Statistical significance is indicated (****p < 0.0001).

