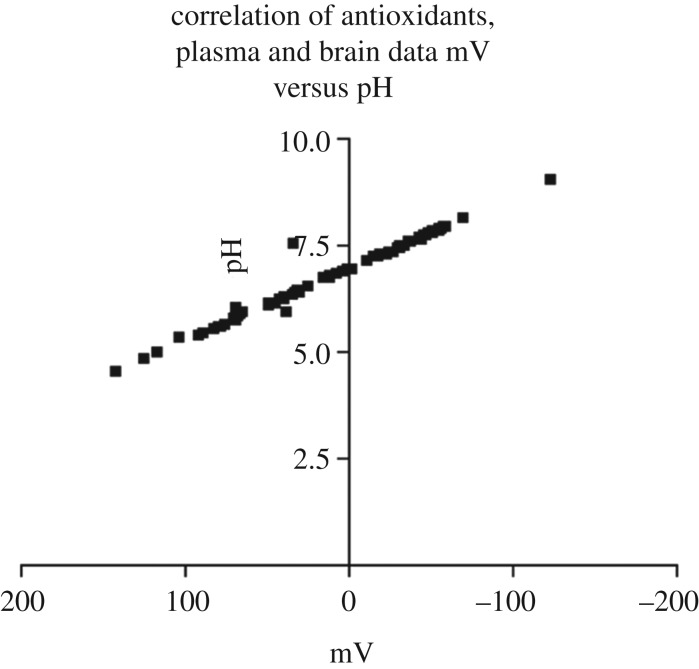
Figure 4.
A graphical representation of the correlation of mV versus pH of all antioxidants, plasma and brain data. Statistical analysis using Graphpad Prism 3 for Windows 95/98 demonstrated a very strong relationship between mV and pH (r2 = 0.9822). Furthermore, this was shown not only in antioxidant solutions but also in herbal extracts, fruit juices, wine, biological fluids and homogenised tissues. The results suggest that a simple pH mV−1 assessment of antioxidant solutions, biological fluids and tissue homogenates can be used to give a reasonably accurate indication of the total antioxidant capacity or redox potential.

