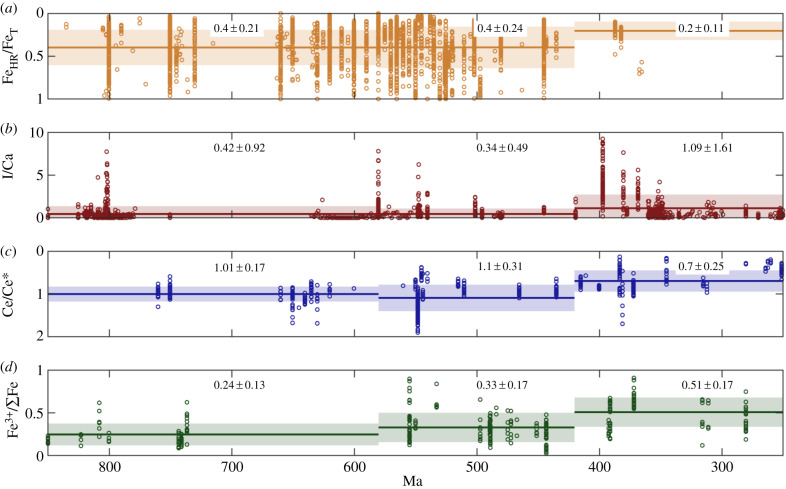
Figure 2.
Geochemical data for local–regional redox proxies from 850 to 250 Ma. Data (open circles) for Fe speciation from shales [14], I/Ca ratios in carbonate rocks [10,26–28], Ce anomalies in carbonate rocks [29–31] and Fe3+/∑Fe ratios of seafloor basalts [15]. The average (solid line) and an error window of 1 standard deviation (shaded region) are shown for time bins 850–580, 580–420 and 420–250 Ma.

