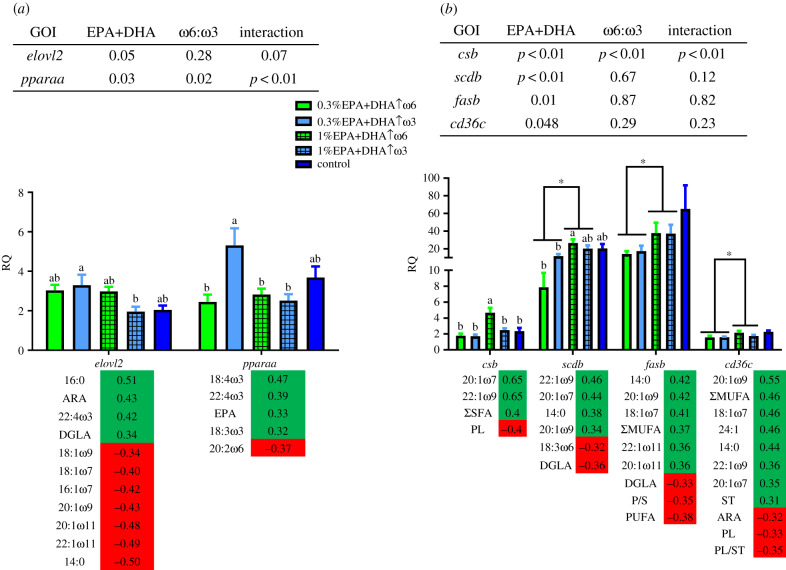
Figure 1.
Effect of diets on the transcript levels of lipid-related biomarkers. (a) Transcripts with putative roles in C18-polyunsaturated fatty acid elongation (elovl2) and the master regulator transcription factor pparaa. (b) Transcripts related to the Krebs cycle (csb), de novo fatty acid synthesis (scdb and fasb) and fatty acid transport (cd36c). The transcript RQs (relative quantities) are shown as mean ± s.e. Bars with different letters are significantly different for a one-way ANOVA across dietary treatments. P-values from a two-way ANOVA are given in the upper table (significance is shown with asterisks (*) on the figure). The listed fatty acids (lower table) are significantly correlated with the corresponding biomarker and placed to show the correlation direction (i.e. green for positive and red for negative). Diets fed: 0.3%EPA+DHA↑ω6, 0.3%EPA+DHA↑ω3, 1%EPA+DHA↑ω6, 1%EPA+DHA↑ω3 and the control diet (1.4% EPA+DHA+balanced levels of ω3+ω6).

