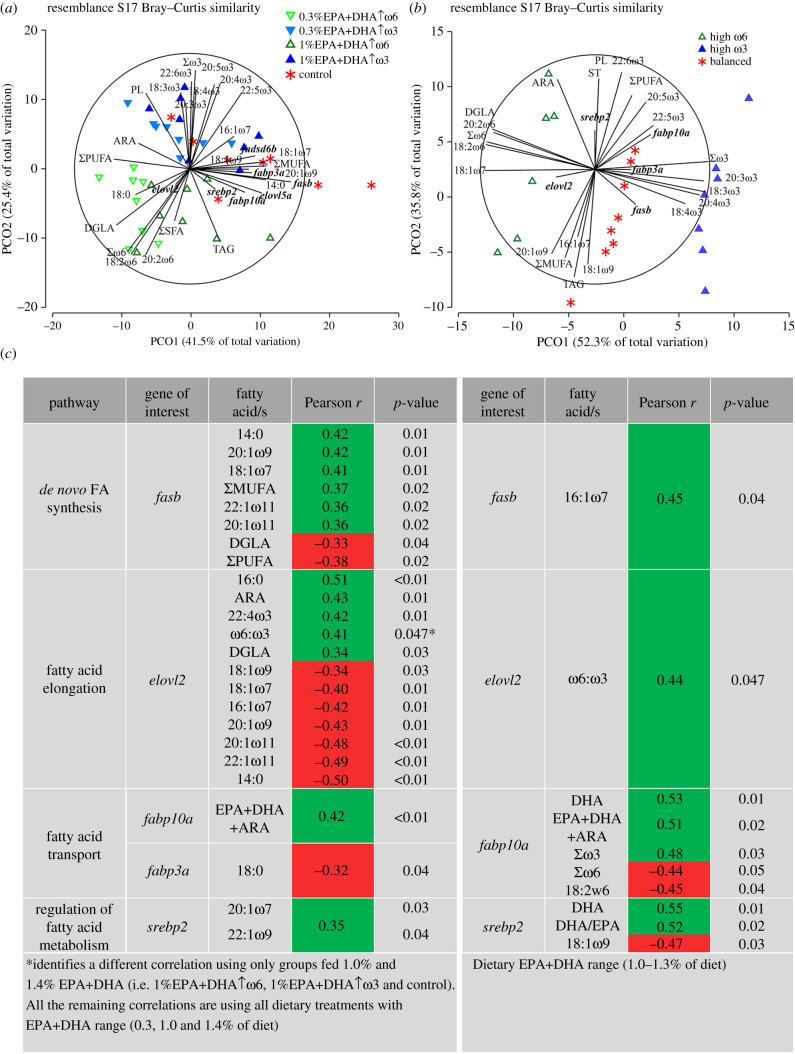
Figure 2.
Principal coordinates analysis (PCoA) of the same transcripts and muscle fatty acids from the two trials showing vectors with Pearson's r > 0.45. (a) PCoA and significant bivariate correlations (below on the left in (c)) between muscle fatty acids percent and liver transcript levels for the 0.3–1.4%EPA+DHA trial. (b) PCoA and significant bivariate correlations (below on the right in (c)) between muscle fatty acids percent and liver transcript levels for the 1–1.3%EPA+DHA trial. Transcripts are bolded on both plots. (c) Fatty acid (%) significant correlations with liver transcript levels; an asterisk (*) identifies the results of a different correlation using only groups fed 1.0% and 1.4% EPA+DHA in the 0.3–1.4%EPA+DHA trial.

