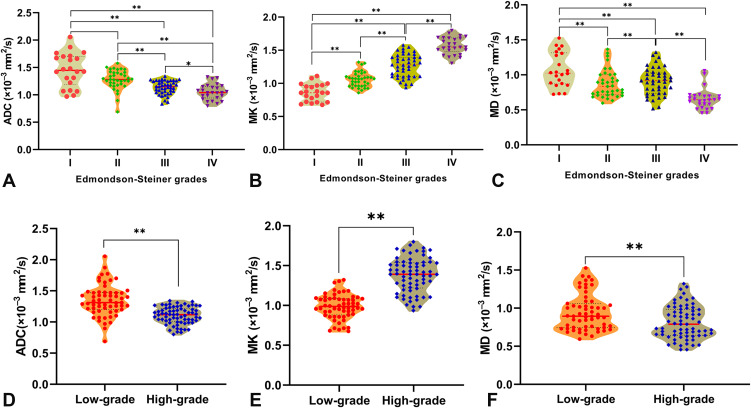
Figure 3.
The Violin plots of the ADC, MK and MD values classified by HCC pathological grade. Significant differences were observed in ADC (A), MK (B) and MD (C) values among different pathological grades I, II, III, and IV. The differences in ADC (D), MK (E) and MD (F) values between low- and high-grade HCC were also statistically significant (**P<0.001; *P<0.05).

