. 2020 May 29;9:e57127. doi: 10.7554/eLife.57127

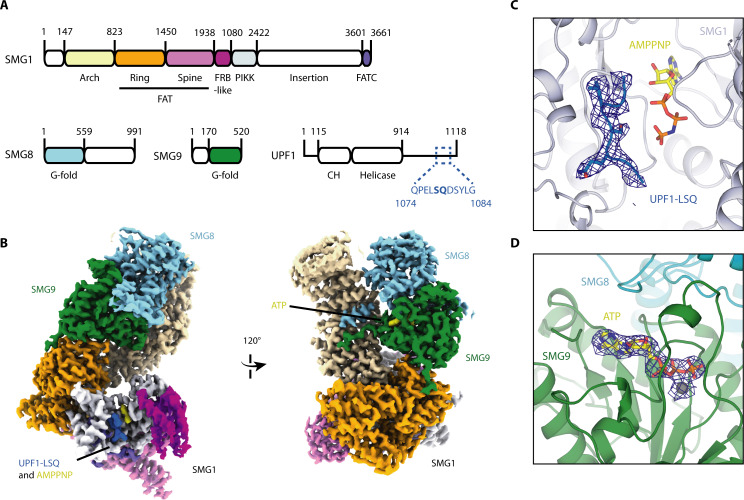
Figure 1. Cryo-EM reconstruction of SMG1-8-9 bound to UPF1-LSQ.

(A) Domain organization of SMG1, SMG8, SMG9 and UPF1. White parts are not resolved in the reconstruction. The sequence and location of UPF1-LSQ is indicated with blue text and dotted lines. (B) Segmented cryo-EM reconstruction of substrate-bound SMG1-8-9. Two different views are shown; proteins and domains are colored as in A. (C) A zoomed-in view of SMG1 showing the kinase active site with bound AMPPNP and UPF1-LSQ. Reconstructed density for UPF1-LSQ is shown as a blue mesh. (D) Zoom-in showing ATP bound to SMG9 with reconstructed density displayed as a blue mesh.

Figure 1.

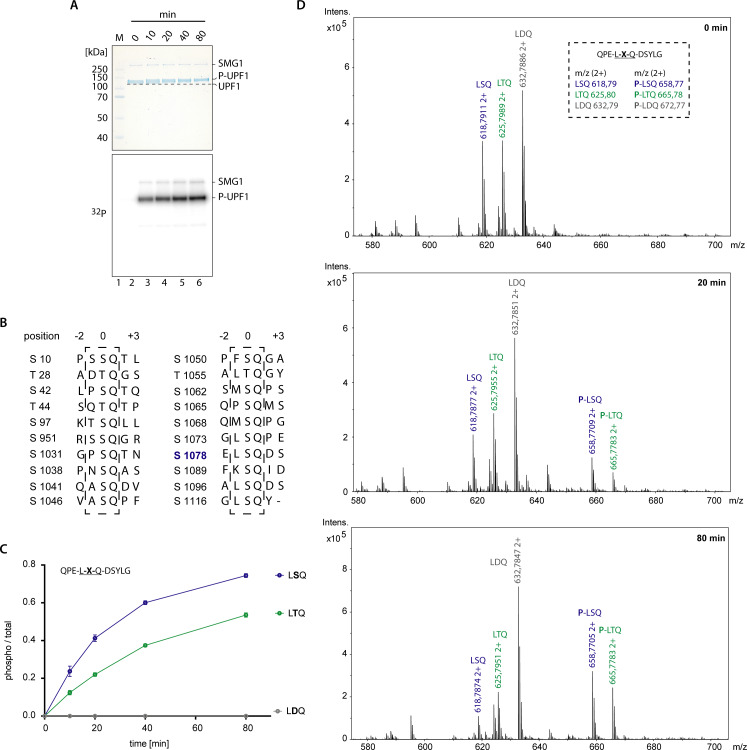
Figure 1—figure supplement 1. SMG1-8-9 activity and UPF1 SQ motifs.

Figure 1—figure supplement 1.

(A) Radioactive phosphorylation assay using SMG1-8-9 and full-length UPF1. Coomassie-stained SDS-PAGE showing a change in migration behavior for UPF1 over time as phosphorylation proceeds. The corresponding radioactive signal is shown in the lower panel indicating an increase of UPF1 phosphorylation over time. (B) Alignment showing all SQ motifs present in UPF1 N- and C-terminus including positions −2 to +3. Note the high variance amongst position −1 residues. (C) Mass spectrometry-based phosphorylation assay with UPF1-LSQ and the indicated position 0 variations. The peptide sequence is indicated with the varying position marked as ‘X’. Error bars representing standard deviations calculated from independent experimental triplicates are shown. Phosphorylation was abolished when the phospho-acceptor residue was changed from Ser to Asp. This shows Ser1081 was not recognized for phosphorylation and confirms specificity toward the SQ motif. In addition, phosphorylation was decreased when Ser was changed to Thr, consistent with previous data for ATM, ATR and DNA-PK (Kim et al., 1999; O'Neill et al., 2000). (D). M/z spectra for representative single measurements at indicated time points of the experiment shown in C. The inset lists the expected sizes for the three peptides used in this experiment. Peaks corresponding to unphosphorylated and phosphorylated peptides are highlighted. Note the appearance and increase of intensity of peaks corresponding to phosphorylated peptides over time.
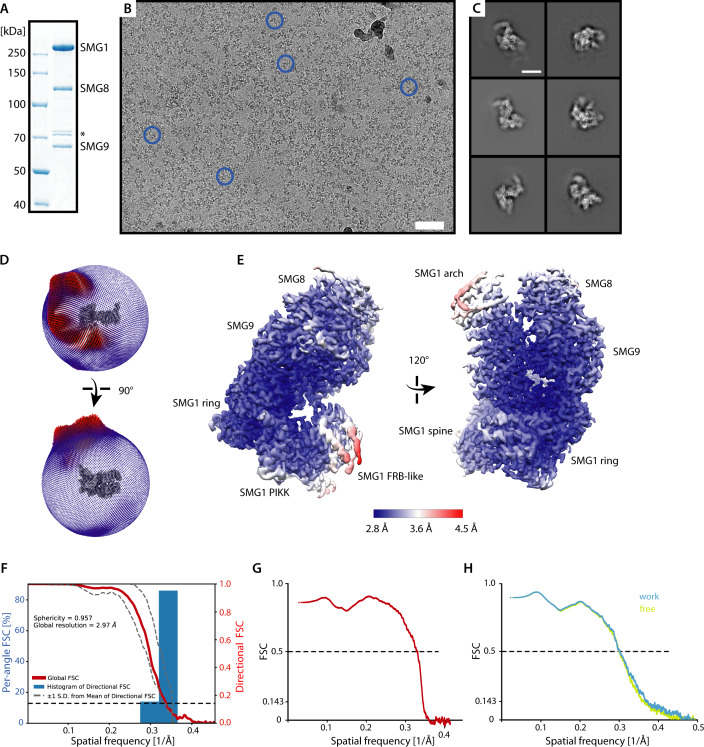
Figure 1—figure supplement 2. Cryo-EM analysis of SMG1-8-9 bound to UPF1-LSQ.

Figure 1—figure supplement 2.

(A) Coomassie-stained SDS-PAGE showing purified SMG1-8-9. The asterisk indicates contaminants. (B) Representative micrograph of the collected data set with some SMG1-8-9 particles indicated by blue circles. Scale bar ≈ 500 Å. (C) Representative 2D averages of picked particles. Scale bar ≈ 100 Å. (D) Spherical angular distribution of particles contributing to the final reconstruction with larger red rods indicating more prominent particle views and smaller blue rods indicating rarer particle views. (E) Map of SMG1-8-9 colored according to estimated local resolution shown in two different views as in Figure 1B. Large parts of the complex including the kinase domain and the bound UPF1 peptide are resolved to around 3 Å. Important features of the map are indicated. (F) Three-dimensional FSC plot and further analysis of orientation bias. The red line represents the estimated global masked half-map FSC curve indicating a nominal overall resolution of 2.97 Å according to the gold standard FSC cut off of 0.143 (Rosenthal and Henderson, 2003). The spread of directional resolution values is defined as ± 1σ (shown as dashed grey lines). Overall isotropy of the map is confirmed by a sphericity of 0.957 (out of 1) (Tan et al., 2017). (G) Model vs. map FSC plot for the real spaced refined model. (H) Model vs. map FSC plots for half map 1 ("work") used for real space refinement after displacing atoms of the final model (σ = 0.5 Å) and half map 2 not used for refinement ("free"). The good agreement of the two curves indicates that no substantial overfitting took place.
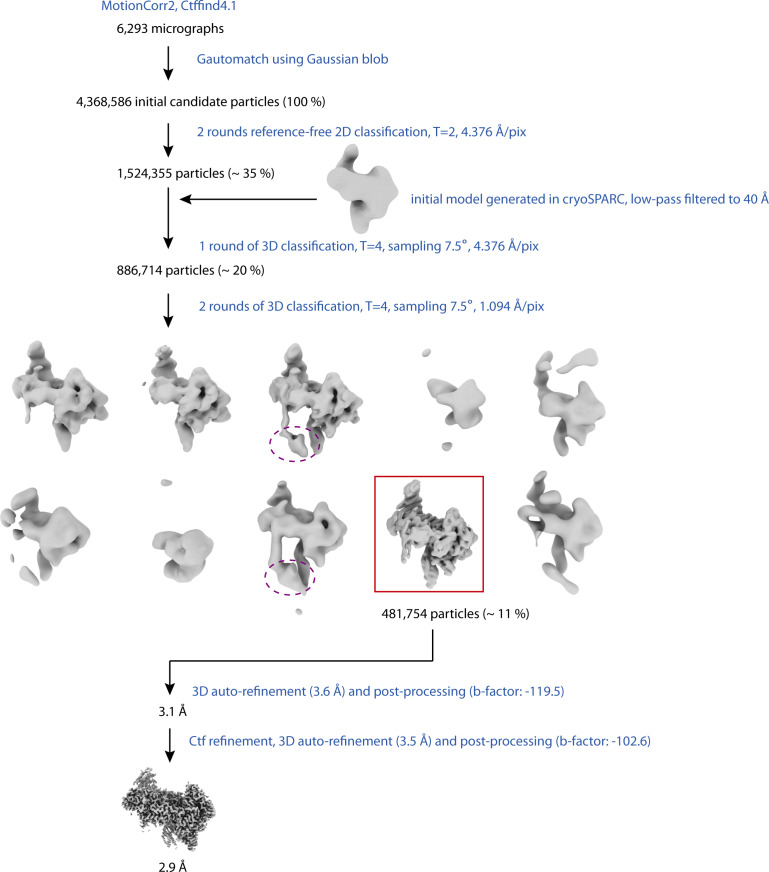
Figure 1—figure supplement 3. Cryo-EM data processing scheme.

Figure 1—figure supplement 3.

Processing steps are indicated in blue; particle numbers of classes used for downstream processing steps (in brackets: percentage with respect to initial candidate particles) and resolutions are in black. The class selected for the 3D refinement after the last step of 3D classification is indicated by a red rectangle. Density for the unmodelled, C-terminal part of SMG8 appearing in two other 3D classes not used for the final reconstruction is highlighted in magenta. This part of SMG8 has been suggested to contribute to kinase regulation (Zhu et al., 2019).
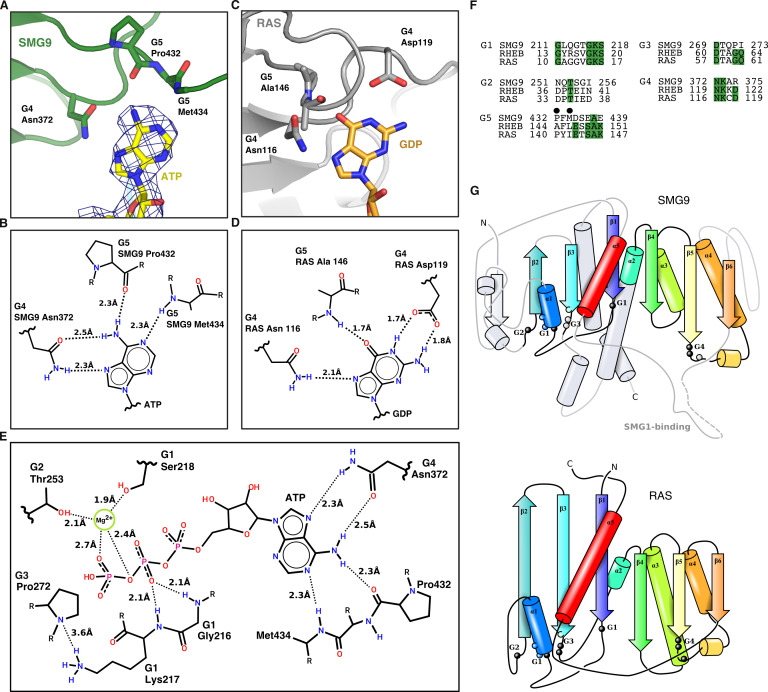
Figure 1—figure supplement 4. SMG9 is a G-fold containing protein binding ATP and exhibits distinct differences to the bona fide GTPase RAS.

Figure 1—figure supplement 4.

(A) Detailed view of ATP purine ring recognition by SMG9 with important residues highlighted and reconstructed density indicated. (B) Two-dimensional sketch of adenine base recognition by SMG9 shown in panel A with G motifs, key residues and distances indicated. (C) Detailed view of GTP recognition by the GTPase RAS with important residues highlighted (PDB ID 1ZVQ). (D) Two-dimensional sketch of guanine base recognition shown in panel C by RAS with G motifs, key residues and distances indicated for comparison with panel B (based on PDB ID 1ZVQ). (E) Two-dimensional sketch of the overall recognition of ATP by SMG9. The G1-G3 motifs of SMG9 coordinate the phosphate moieties of ATP, similarly to the corresponding motifs of canonical GTPases, but with an important exception, in that they lack the typical residues crucial for catalysis. Another difference with canonical G-fold is that the G4 and G5 motifs responsible for the recognition of the base have rearranged to preferentially bind an adenine base rather than a guanine. (F) Sequence alignment of G motifs of RHEB and RAS GTPases with SMG9. Residues highlighted in A are indicated by a black dot. In the G4 motif, the aspartic acid that specifically engages the guanine moiety in GTPases has diverged to an arginine residue. Instead, Asn372 in the SMG9 G4 motif has shifted so that it engages the side-chain carbonyl group to interact with the adenine amino group (compare panels A and B with C and D). In the G5 motif, the SAK consensus sequence in RAS and RHEB has diverged in SMG9, with the main-chain carbonyl and amine groups of the upstream residues, Pro432 and Met434, forming adenine-specific interactions (compare panels A and B with C and D). (G) Three-dimensional sketches of SMG9 (top) and RAS/RHEB (bottom) highlighting similarities in their overall topology. Positions of the G motifs are highlighted.
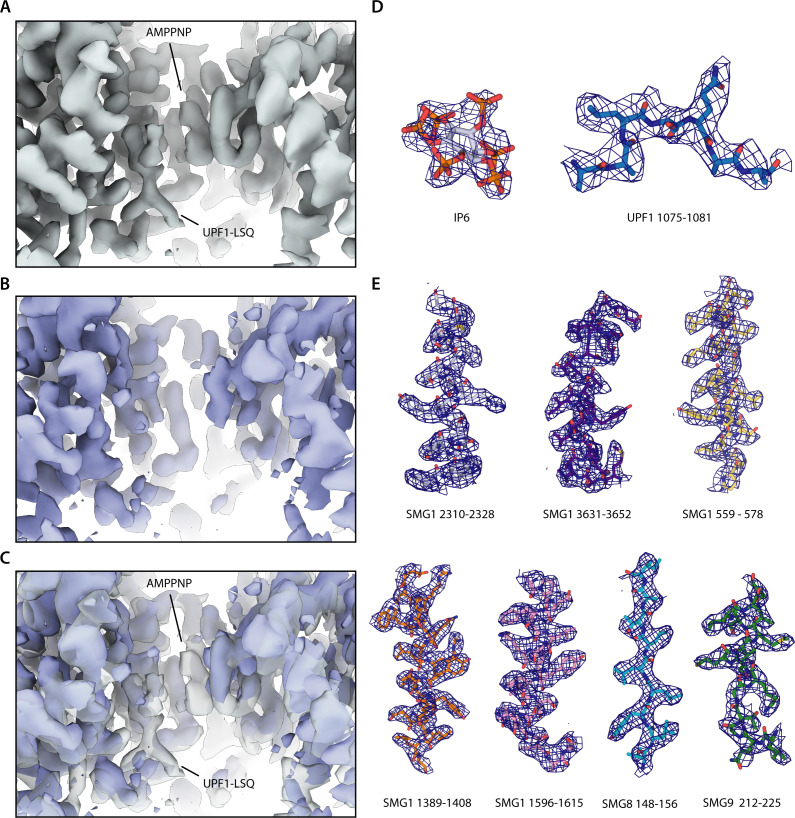
Figure 1—figure supplement 5. Quality of the reconstructed density.

Figure 1—figure supplement 5.

(A) Active site density reported in this study. Densities attributed to either AMPPNP or UPF1 peptide are indicated. (B) Active site density of the apo SMG1-8-9 reconstruction reported previously (EMDB 10347). (C) Overlay of the active site densities shown in A and B with the active site density reported in this study shown in transparent grey and density of apo SMG1-8-9 (EMDB 10347) shown in blue. Densities attributed to either AMPPNP or UPF-LSQ are indicated. (D) Model of IP6 and UPF1-LSQ with the corresponding density shown as a blue mesh. Colors of the model as in Figure 1. (E) Additional parts of the model with the corresponding density shown as in B.