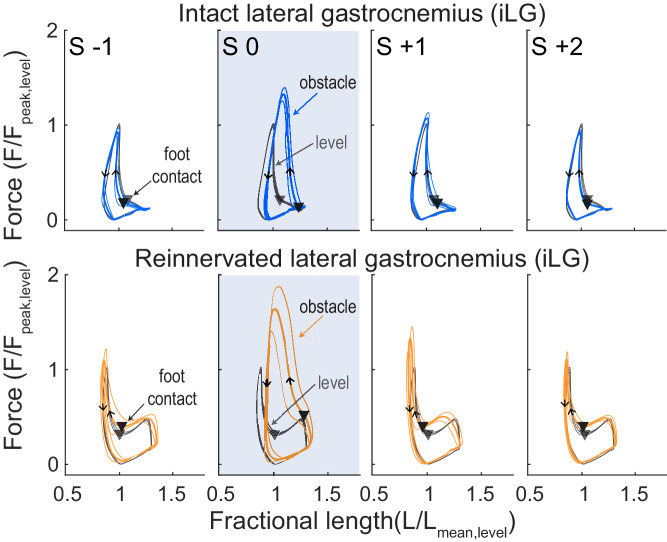
Figure 3. Force-length work loops for iLG (top) and rLG (bottom), for a single individual from each treatment cohort (intact/reinnervated, mean ±95% ci).
Level mean in grey and obstacle strides in colored lines (iLG: blue, rLG: orange). Stride categories as in Figure 2, where the shaded box is an obstacle encounter (S 0). Triangles indicate the timing of foot-ground contact and arrows indicate the direction of the work loop, with a counter-clockwise loop corresponding to net positive muscle work.

