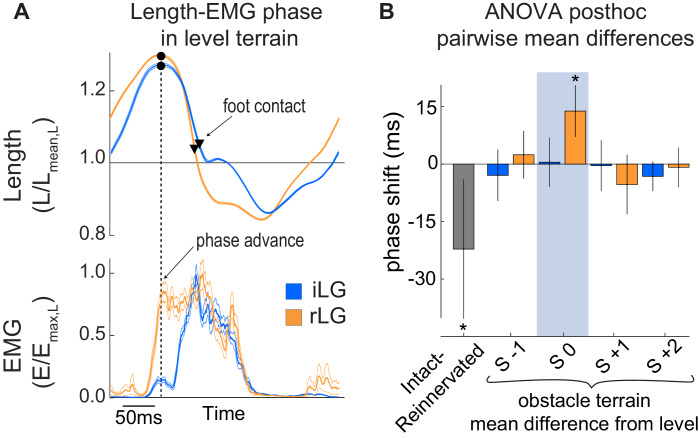
Figure 6. Phase relationship (Ephase) between length and EMG activation.
(A) Average steady-state length and activation trajectories for iLG and rLG in level terrain, aligned in time based on peak length during the swing phase, before foot-substrate contact. Black dot and vertical dashed line indicate the time of peak fascicle length. Triangles indicate timing of foot contact. (B) Pairwise mean differences in Ephase (mean ±95% ci) between intact and reinnervated treatment cohorts (grey), and obstacle stride categories compared to level terrain within each cohort (colored bars). Ephase is reported in the ANOVA tables as a fraction of the stride cycle but is reported in milliseconds here.

