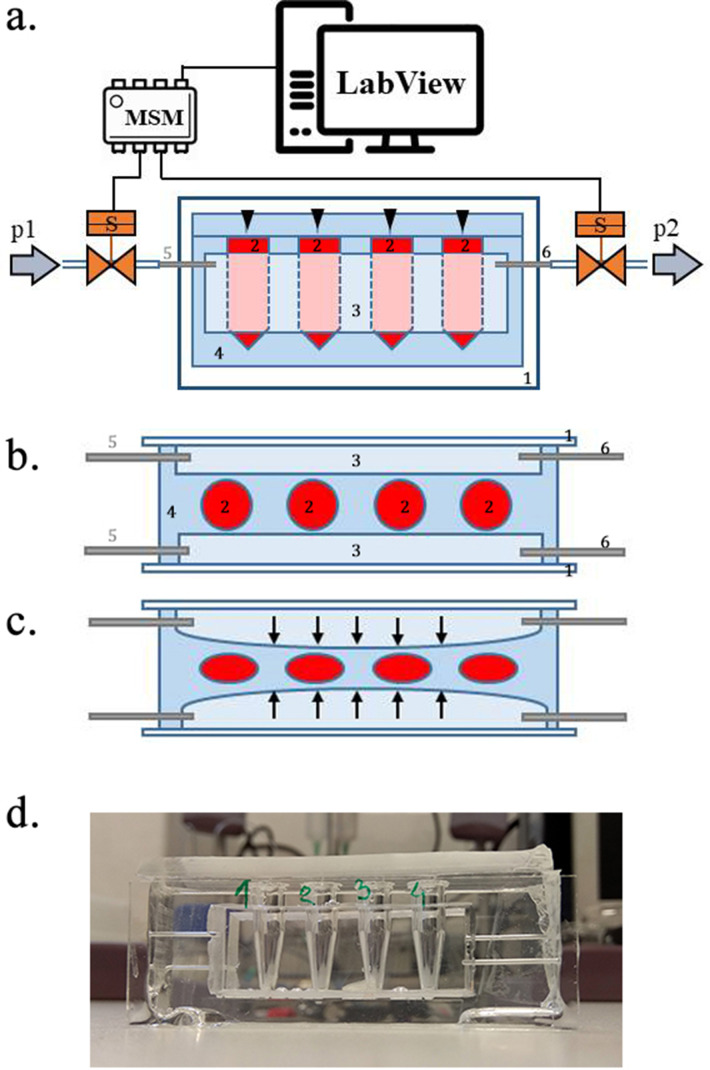
Figure 13. Scheme of the experimental setup.
(a) Scheme of the set-up with the pressure oscillator connected to the Eppendorf chip with side view and b) top view of the ‘Eppendorf chip’.Numbers indicate the glass slide (1), the sample chambers (2), the cuboidal cavity (3), the PDMS and the inlet (5) and outlet (6)Stubbs et al., 2019 steel capillaries, respectively. (b–c) Schematic representation of the chip’s operation upon applied pressure: the cavity (3) expands towards the sample chambers (2) squeezing and deforming them. (d) Photo of the constructed device prior to filling and connecting to the pressure controller.

