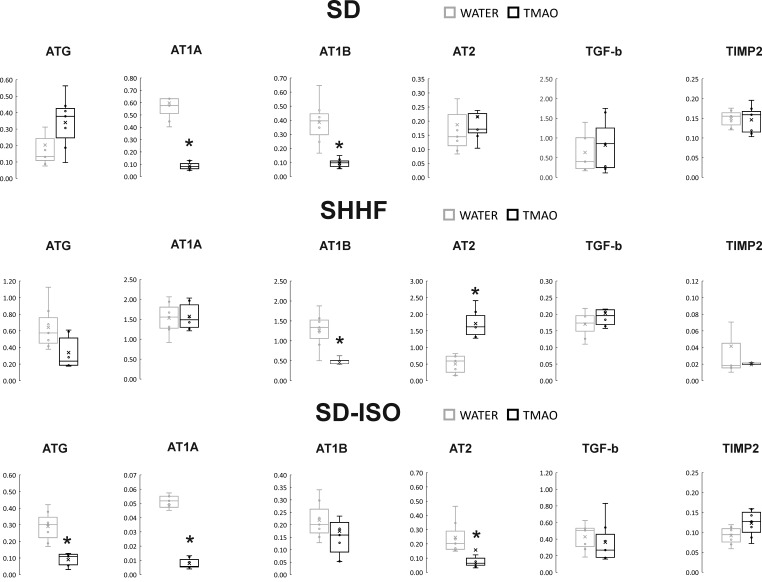
Figure 4. Real-time RT-PCR analysis, heart.
Box plot comparing the expression profiles of ATG (angiotensinogen), AT1A (angiotensin II receptor type 1a), AT1B (angiotensin II receptor type 1b), AT2 (angiotensin II receptor type 2), TGF-b (transforming growth factor-beta), TIMP2 (metalloproteinase inhibitor 2) in hearts of SD – Sprague-Dawley rats, SHHF - Spontaneously Hypertensive Heart Failure (SHHF/MccGmiCrl-Leprcp/Crl), SD-ISO - SD rats treated with ISO at the age of 56 week, drinking either water (control groups) or TMAO solution, (n = 6–7 for each series). × - mean value, * indicates significant difference compared with the control group. *p<0.05 by t-test or Mann-Whitney U test.

