. 2020 Jul 3;9:e54536. doi: 10.7554/eLife.54536

Figure 3. Experiment 1 – Responses of the PAM to stimuli from the back speakers, showing intersubject variability: Top panels: Every row corresponds to the averaged response of one participant.

Amplitude is encoded in color. The top rows (1-16) represent younger adult participants; the bottom rows (17-28), older adults. Bottom panels: Mean and standard deviation based on the above plots. The following figure supplements are available for Figure 3—figure supplement 1. The described intersubject variability analysis for the AAM, Figure 3—figure supplement 2. SAM, and Figure 3—figure supplement 3. TAM.

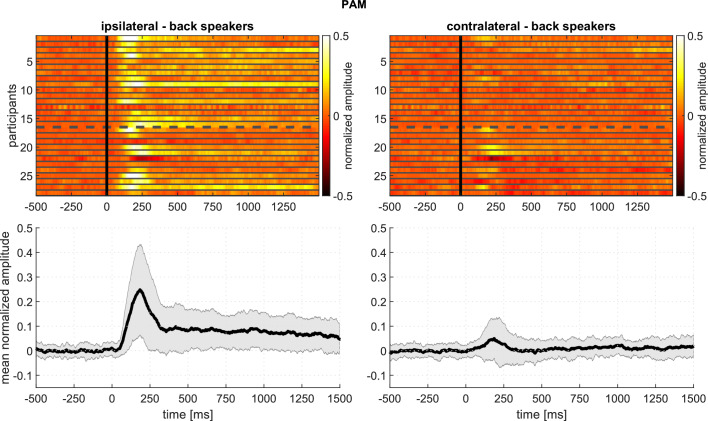
Figure 3.

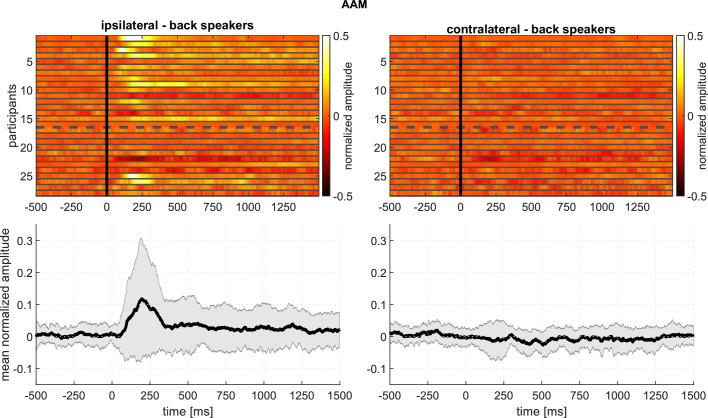
Figure 3—figure supplement 1. Experiment 1 – Responses of the AAM to stimuli from the back speakers, showing intersubject variability: Top panels: Every row corresponds to the averaged response of one participant.

Figure 3—figure supplement 1.

Amplitude is encoded in color. The top rows (1-16) represent younger adult participants; the bottom rows (17-28), older adults. Bottom panels: Mean and standard deviation based on the above plots.
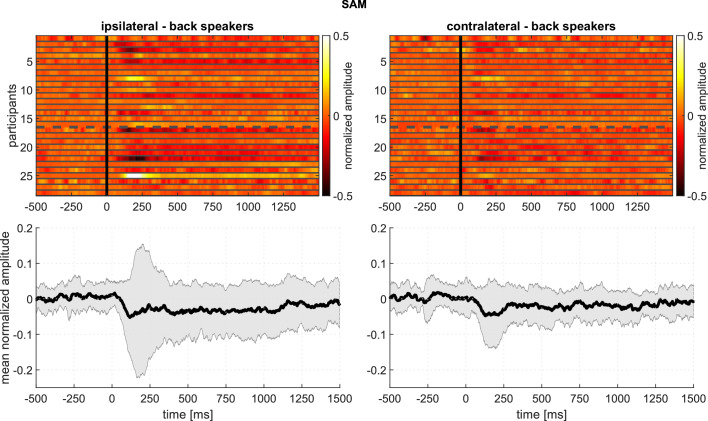
Figure 3—figure supplement 2. Experiment 1 – Responses of the SAM to stimuli from the back speakers, showing intersubject variability: Top panels: Every row corresponds to the averaged response of one participant.

Figure 3—figure supplement 2.

Amplitude is encoded in color. The top rows (1-16) represent younger adult participants; the bottom rows (17-28), older adults. Bottom panels: Mean and standard deviation based on the above plots.
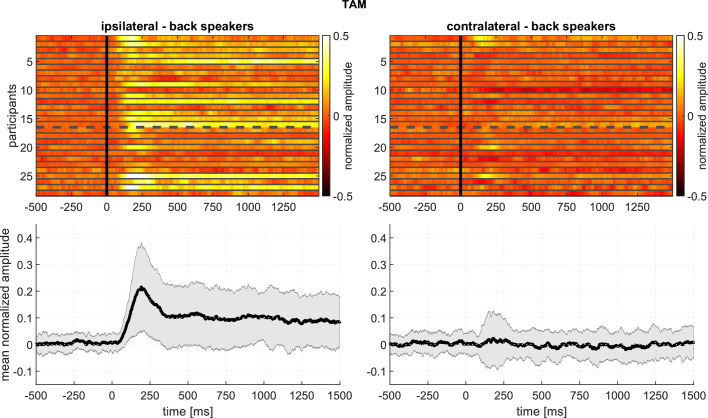
Figure 3—figure supplement 3. Experiment 1 – Responses of the TAM to stimuli from the back speakers, showing intersubject variability: Top panels: Every row corresponds to the averaged response of one participant.

Figure 3—figure supplement 3.

Amplitude is encoded in color. The top rows (1-16) represent younger adult participants; the bottom rows (17-28), older adults. Bottom panels: Mean and standard deviation based on the above plots.