. 2020 Jul 3;9:e54536. doi: 10.7554/eLife.54536

Figure 7. Experiment 1: Averaged horizontal EOG activity at around the time of stimulation from the back speakers, showing an apparent absence of systematic shifts in gaze direction: Top panels: Every row corresponds to the averaged response of one participant.

Gaze angle is encoded in color, such that positive values (yellow) indicate rightward eye movements/positive angles. The top rows (1-16) represent younger adult participants; the bottom rows (17-28), older adults. Bottom panels: Mean and standard deviation based on the above plots.The following figure supplements are available for Figure 7—figure supplement 1. Macrosaccades during reading for one subject as example; Figure 7—figure supplement 2. Boxplots of the EOG for all subjects; Figure 7—figure supplement 3. Density of all detected macrosaccades during Experiment 1; Figure 7—figure supplement 4. Responses of the M. sternocleidomastoideus to stimuli from the front speakers; Figure 7—figure supplement 5. Responses of the M. sternocleidomastoideus to stimuli from the back speakers; Figure 7—figure supplement 6. Responses of the M. frontalis to stimuli from the front speakers; Figure 7—figure supplement 7. Responses of the M. frontalis to stimuli from the back speakers; Figure 7—figure supplement 8. Responses of the M. zygomaticus to stimuli from the front speakers; Figure 7—figure supplement 9. Responses of the M. zygomaticus to stimuli from the back speakers.

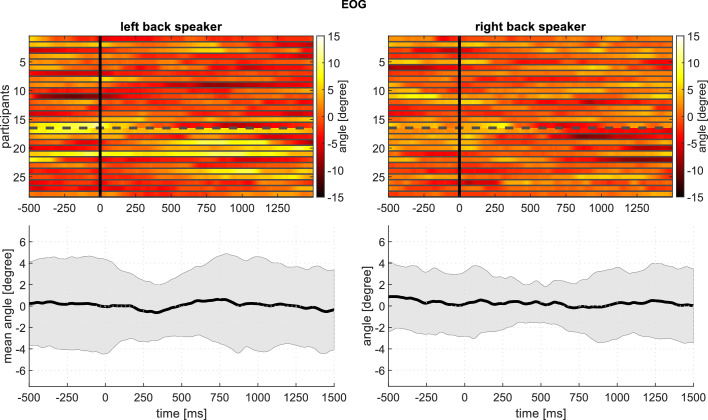
Figure 7.

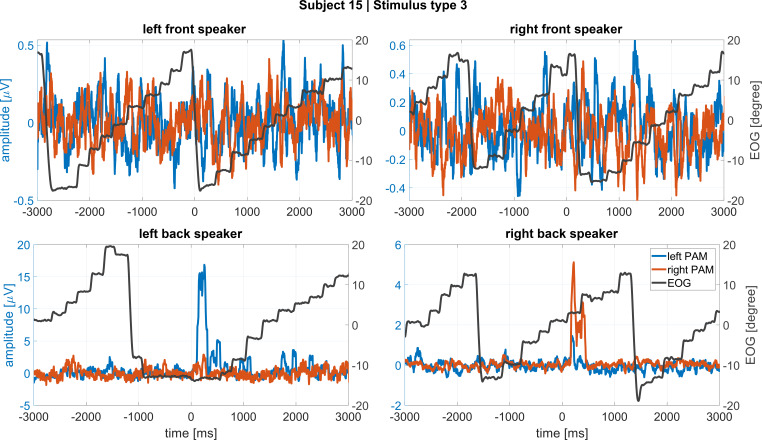
Figure 7—figure supplement 1. Macrosaccades during reading in Experiment one as recorded by means of horizontal EOG (black line) along with time-synchronized EMG from left and right PAM (blue and orange lines, respectively).

Figure 7—figure supplement 1.

This participant (# 15) had large, clear PAM responses. Different trials are shown in the four panels. Note that muscle activations occur without saccades and large saccades occur without muscle responses.
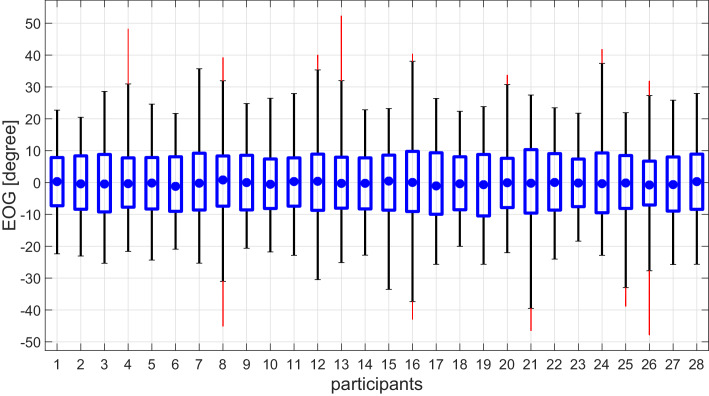
Figure 7—figure supplement 2. Boxplots of EOG signals from all subjects in Experiment 1.

Figure 7—figure supplement 2.

Every stimulus presentation, including 3 s long pre– and poststimulus intervals, were included. Blue dots mark the median, outliers (data points beyond 1.5 x interquartile range) are displayed in red. Gaze shifts between the edges of the text that subjects were reading from during this experiment generated the largest EOG values. These shifts can be estimated in the upper and lower whiskers.
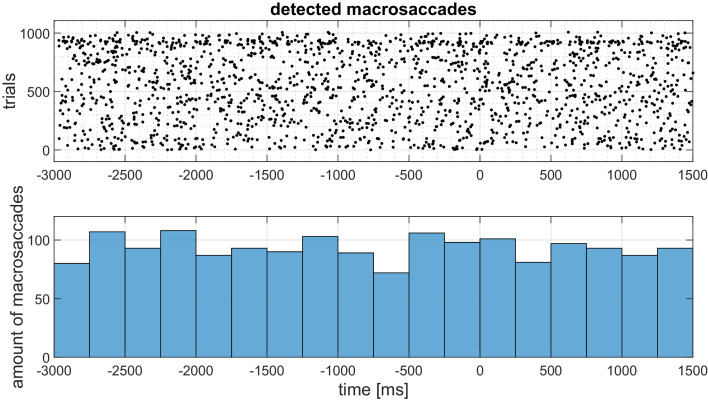
Figure 7—figure supplement 3. Density of detected macrosaccades during Experiment 1.

Figure 7—figure supplement 3.

Top plot: Every line corresponds to one stimulus presentation (trials). Detected macrosaccades are marked by black dots. Across all subjects, 1008 stimuli were presented. Bottom plot: Histogram of detected macrosaccades with respect to time. Macrosaccades were detected by calculating the forward differences g()=f(+n)-f() with n=150 samples (62.5 ms) for every point and thresholding |g()|>α=10. Both n and α were determined empirically to reliably detect saccades when the subjects jump from a given line to the next one.
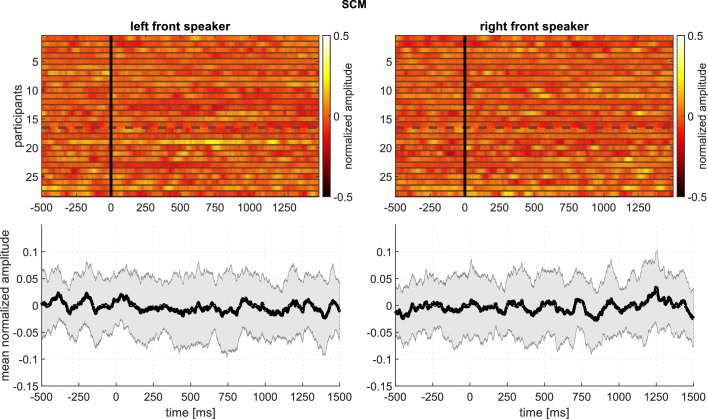
Figure 7—figure supplement 4. Experiment 1 – Responses of the M. sternocleidomastoideus (M.SCM) to stimuli from the front speakers, showing intersubject variability: Top panels: Every row corresponds to the averaged response of one participant.

Figure 7—figure supplement 4.

Amplitude is encoded in color. The top rows (1-16) represent younger adult participants; the bottom rows (17-28), older adults. Bottom panels: Mean and standard deviation based on the above plots.
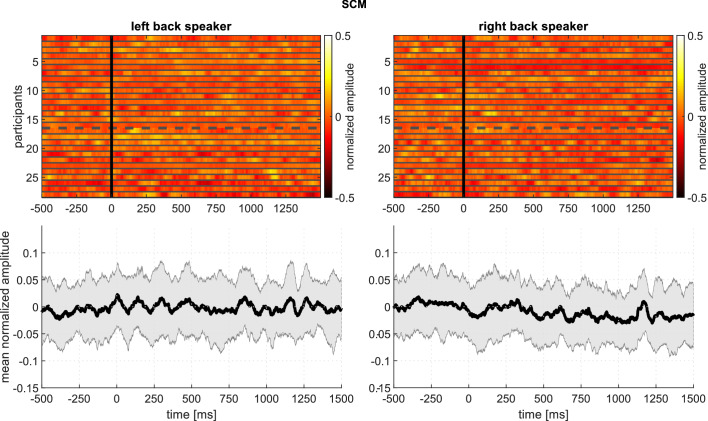
Figure 7—figure supplement 5. Experiment 1 – Responses of the M. sternocleidomastoideus (M.SCM) to stimuli from the back speakers, showing intersubject variability: Top panels: Every row corresponds to the averaged response of one participant.

Figure 7—figure supplement 5.

Amplitude is encoded in color. The top rows (1-16) represent younger adult participants; the bottom rows (17-28), older adults. Bottom panels: Mean and standard deviation based on the above plots.
Figure 7—figure supplement 6. Experiment 1 – Responses of the frontalis muscle to stimuli from the front speakers, showing intersubject variability: Top panels: Every row corresponds to the averaged response of one participant.

Figure 7—figure supplement 6.

Amplitude is encoded in color. The top rows (1-16) represent younger adult participants; the bottom rows (17-28), older adults. Bottom panels: Mean and standard deviation based on the above plots.
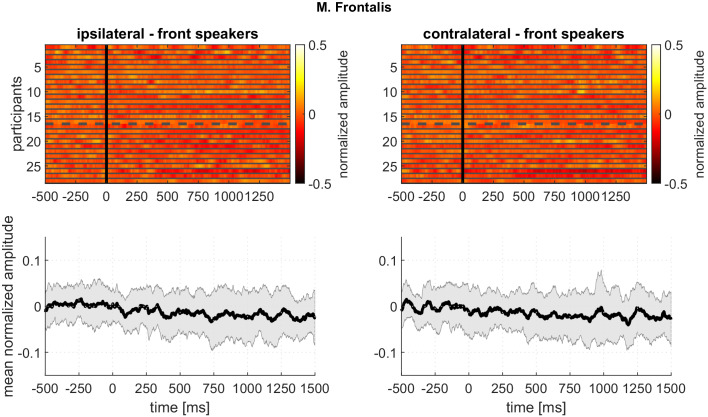
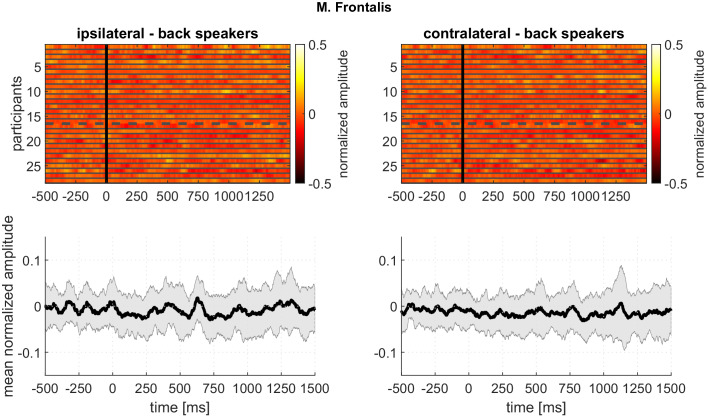
Figure 7—figure supplement 7. Experiment 1 – Responses of the frontalis muscle to stimuli from the back speakers, showing intersubject variability: Top panels: Every row corresponds to the averaged response of one participant.

Figure 7—figure supplement 7.

Amplitude is encoded in color. The top rows (1-16) represent younger adult participants; the bottom rows (17-28), older adults. Bottom panels: Mean and standard deviation based on the above plots.
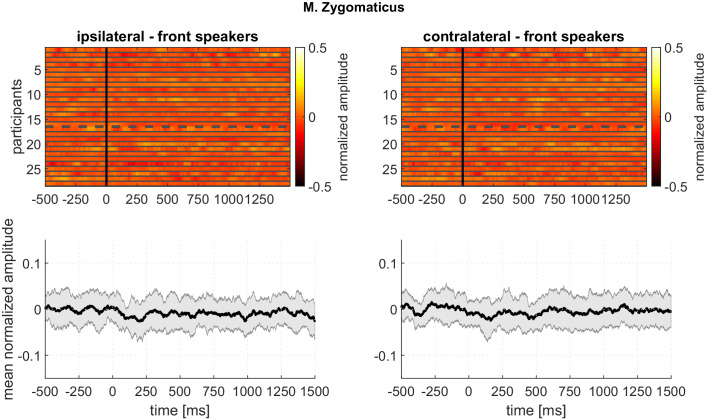
Figure 7—figure supplement 8. Experiment 1 – Responses of the zygomaticus muscle to stimuli from the front speakers, showing intersubject variability: Top panels: Every row corresponds to the averaged response of one participant.

Figure 7—figure supplement 8.

Amplitude is encoded in color. The top rows (1-16) represent younger adult participants; the bottom rows (17-28), older adults. Bottom panels: Mean and standard deviation based on the above plots.
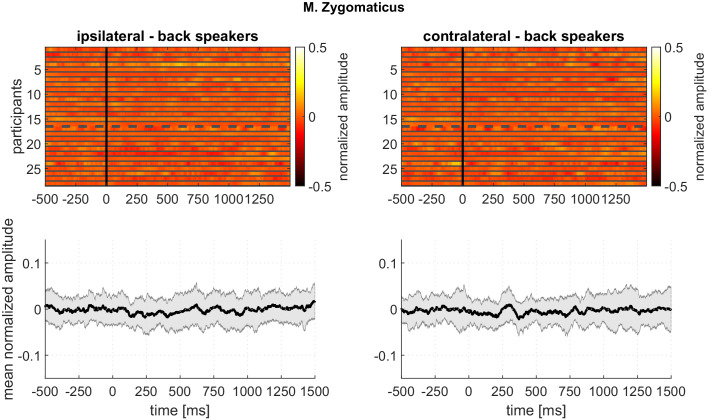
Figure 7—figure supplement 9. Experiment 1 – Responses of the zygomaticus muscle to stimuli from the back speakers, showing intersubject variability: Top panels: Every row corresponds to the averaged response of one participant.

Figure 7—figure supplement 9.

Amplitude is encoded in color. The top rows (1-16) represent younger adult participants; the bottom rows (17-28), older adults. Bottom panels: Mean and standard deviation based on the above plots.