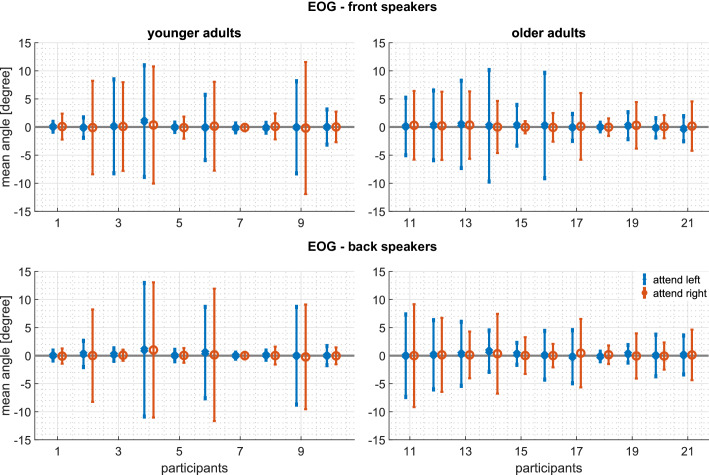
Figure 8. Experiment 2: Intrasubject variability of the horizontal EOG: Mean and standard deviations of the EOG during the complete trial of every participant.
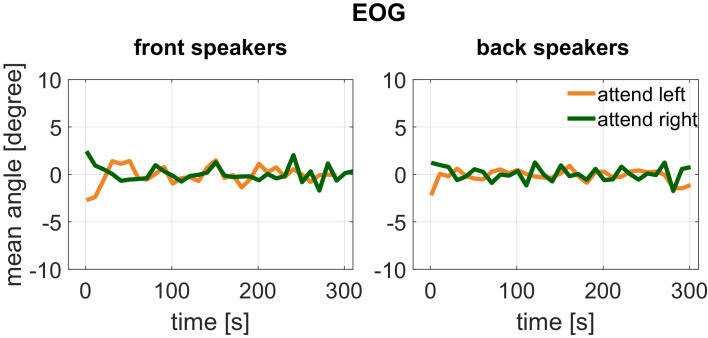
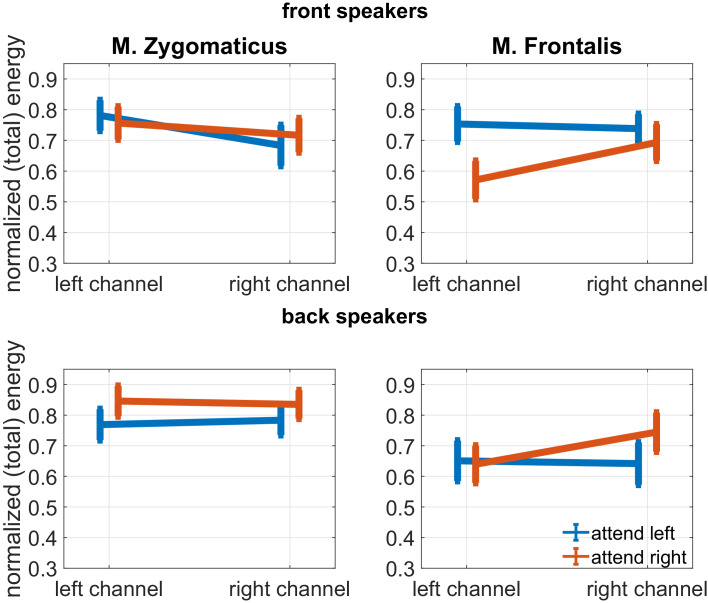
Top panels: attending the front speakers. Bottom panels: attending the back speakers. Left panels: younger adults. Right panels: older adults. Blue represents the EOG when attending the left, red when attending the right speaker. A positive EOG indicates that the gaze is directed toward the side of the attended speaker. Note that the deviation of the mean from is well within one standard deviation and therefore indicates that participants did not systematically divert their gaze to the attended speaker. The following figure supplements are available for Figure 8—figure supplement 1. Time-resolved EOG analysis in Experiment 2; Figure 8—figure supplement 2. Activity of the frontalis and zygomaticus muscle in Experiment 2.


