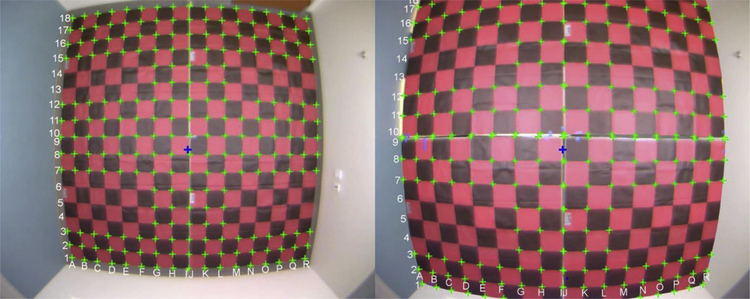
Fig. 3.
Checkerboard pattern illustrating distortion at floor level (left) and 29-in. level (right). NOTE: Green marks are used as a visual aid to show the points selected for distortion analysis. The blue cross marks the center of the room. (For interpretation of the references to colour in this figure legend, the reader is referred to the web version of this article).

