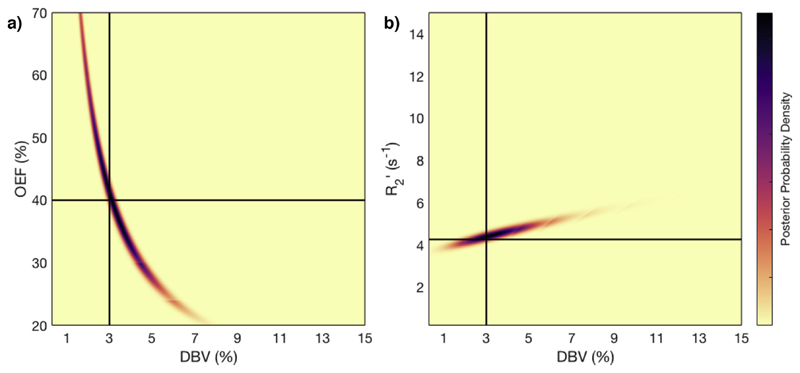
Fig. 1.
Results of grid-search posterior sampling on simulated ASE qBOLD data, with SNR 50. a) Posterior probability of OEF-DBV parameter pairs, with true (simulated) values shown as solid black lines. b) Posterior probability of -DBV pairs, using the same data. In the OEF-DBV model, there is a large area of collinearity, and the posterior density distribution does not have a Gaussian-like form. By contrast, the -DBV model has more separable parameters, and a distribution shape that can more easily be approximated by a multivariate normal distribution, which is a requirement for VB inference as implemented here.

