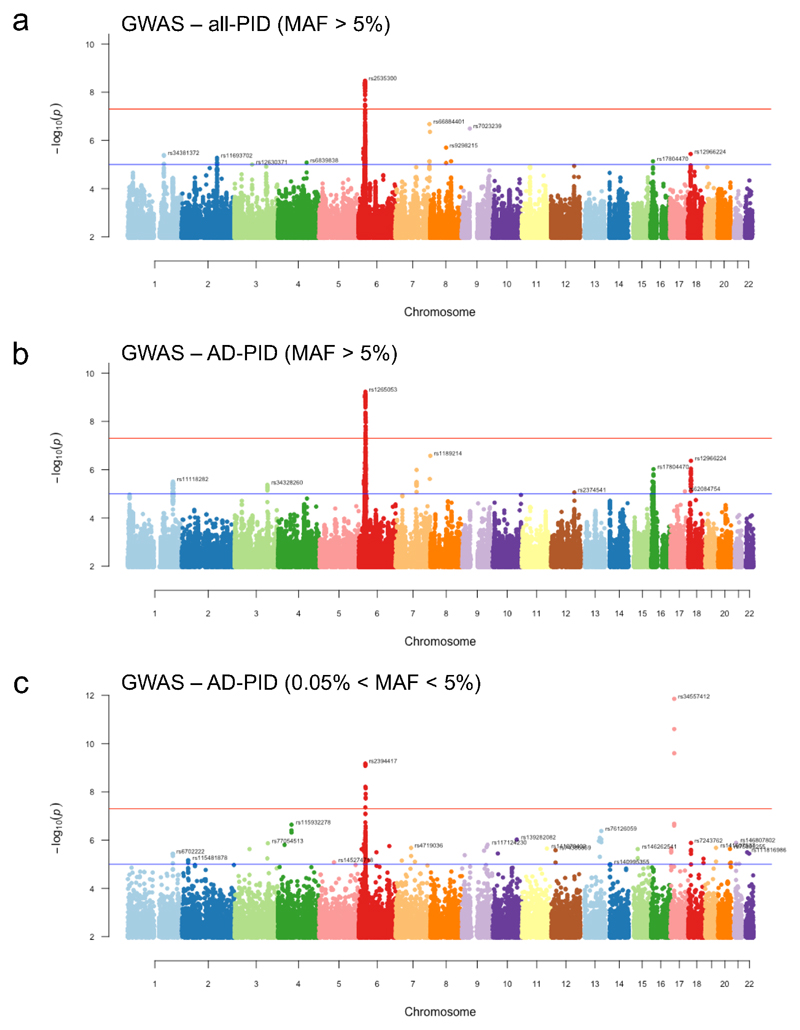
Extended Data Figure 6. Manhattan plots of (a) all-PID MAF>5%, (b) AD-PID MAF>5% and (c) AD-PID 0.5%<MAF<5% GWAS results.
Sample sizes: all-PID cases n=886; AD-PID cases n=733; controls n=9,225. Each point represents an individual SNP association P-value, adjusted for genomic inflation. Only signals with P<1x10⁻² are shown. None of the SNPs in plot (c) appear in the results of the common variant GWAS in (b), and are therefore additional signals gained from a GWAS including variants of intermediate MAF. Red and blue lines represent genome-wide (P<5x10⁻⁸) and suggestive (P<1x10⁻⁵) associations, respectively. Note the additional genome-wide significant signal representing the TNFRSF13B locus, and several suggestive associations that only become apparent with variants in the 0.5% - 5% MAF range shown in (c). Suggestive loci are indicated by the rsID of the lead SNP in each chromosome. Note that lead SNPs in AD-PID GWAS (b) may differ from meta-analysis lead SNPs.

