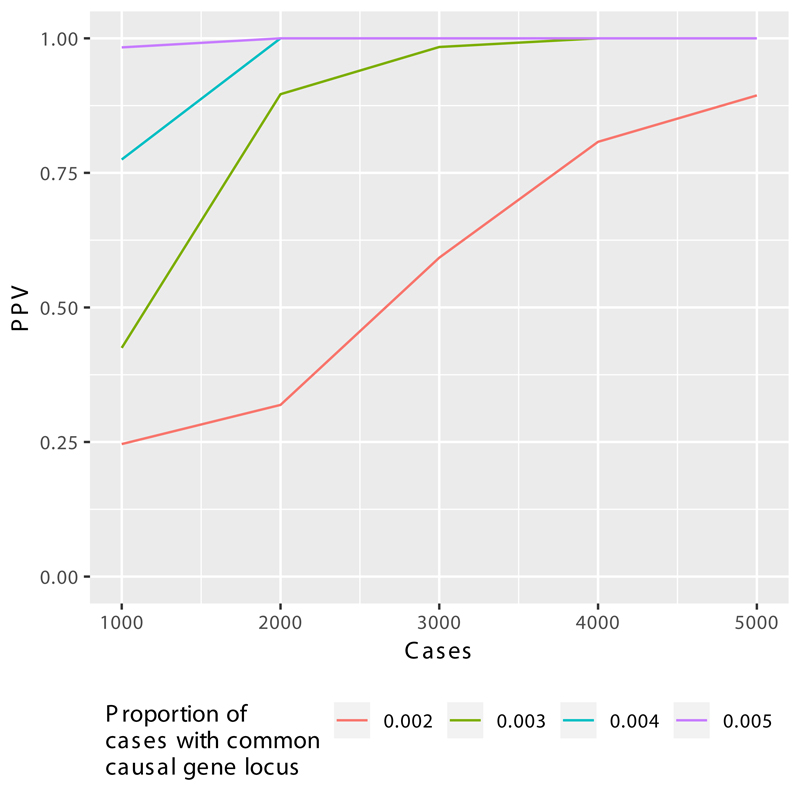
Extended Data Figure 3. BeviMed simulation study of Positive Predictive Value (PPV) with increasing disease cohort size.
We simulated genotypes at 25 rare variant sites in a hypothetical locus amongst 20,000 controls and a further 1,000, 2,000, 3,000, 4,000 or 5,000 cases. We simulated that 0.2%, 0.3%, 0.4% or 0.5% of the cases had the hypothetical locus as their causal locus. We distinguish between cases due to the hypothetical locus (CHLs) and cases due to other loci (COLs). The allele frequency of 20 variants was set to 1/10,000 amongst the cases and COLs. The allele frequency of the remaining 5 variants was set to zero amongst the controls and COLs. One of the five variants was assigned a heterozygous genotype amongst the CTLs at random. Thus, we represent a dominant disorder caused by variants with full penetrance. As inference is typically performed across thousands of loci, with only a small number being causal, we assumed a mixture of 100 to 1 non-causal to causal loci. In order to compute the PPV for a given threshold on the posterior probability of association (PPA), we computed PPAs for 10,000 datasets without permutation of the case/control labels and 10,000 further datasets with a permutation of the case/control labels. We then sampled 1,000 PPAs from the permuted set and 10 PPAs from the non-permuted set to compute the PPV obtained when the PP threshold was set to achieve 100% power. The mean over 2,000 repetitions of this procedure is shown on the y-axis. The x-axis shows the number of cases in a hypothetical cohort. As the number of cases increases from 1,000 to 5,000, the PPV increases above 87.5% irrespective of the proportion of cases with the same genetic aetiology. This demonstrates the utility of expanding the size of the PID case collection for detecting even very rare aetiologies resulting in the same broad phenotype as cases with different aetiologies. In practice, the PPV/power relationship may be much better, as the wealth of phenotypic information of the cases can allow subcategorization of cases to better approximate shared genetic aetiologies.

