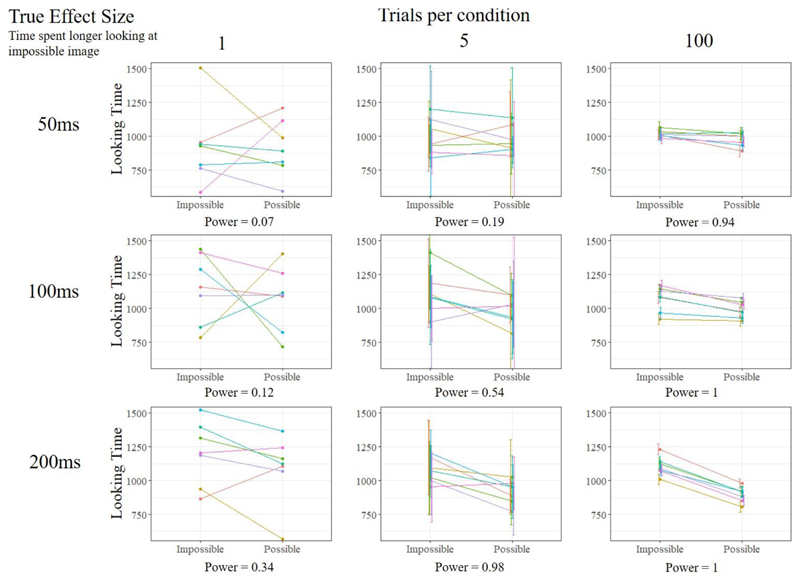
Figure 1.
Graphs showing example data from nine different designs of a looking-time experiment in rooks. These designs vary on the underlying effect size (50 ms, 100 ms, 200 ms), and the number of trials per condition (1, 5, 100). N = 7 for all designs. The power of each design is printed below each graph and was calculated by simulating 10,000 studies in each design and calculating the proportion of p-values less than .05.

