
Figure 3.
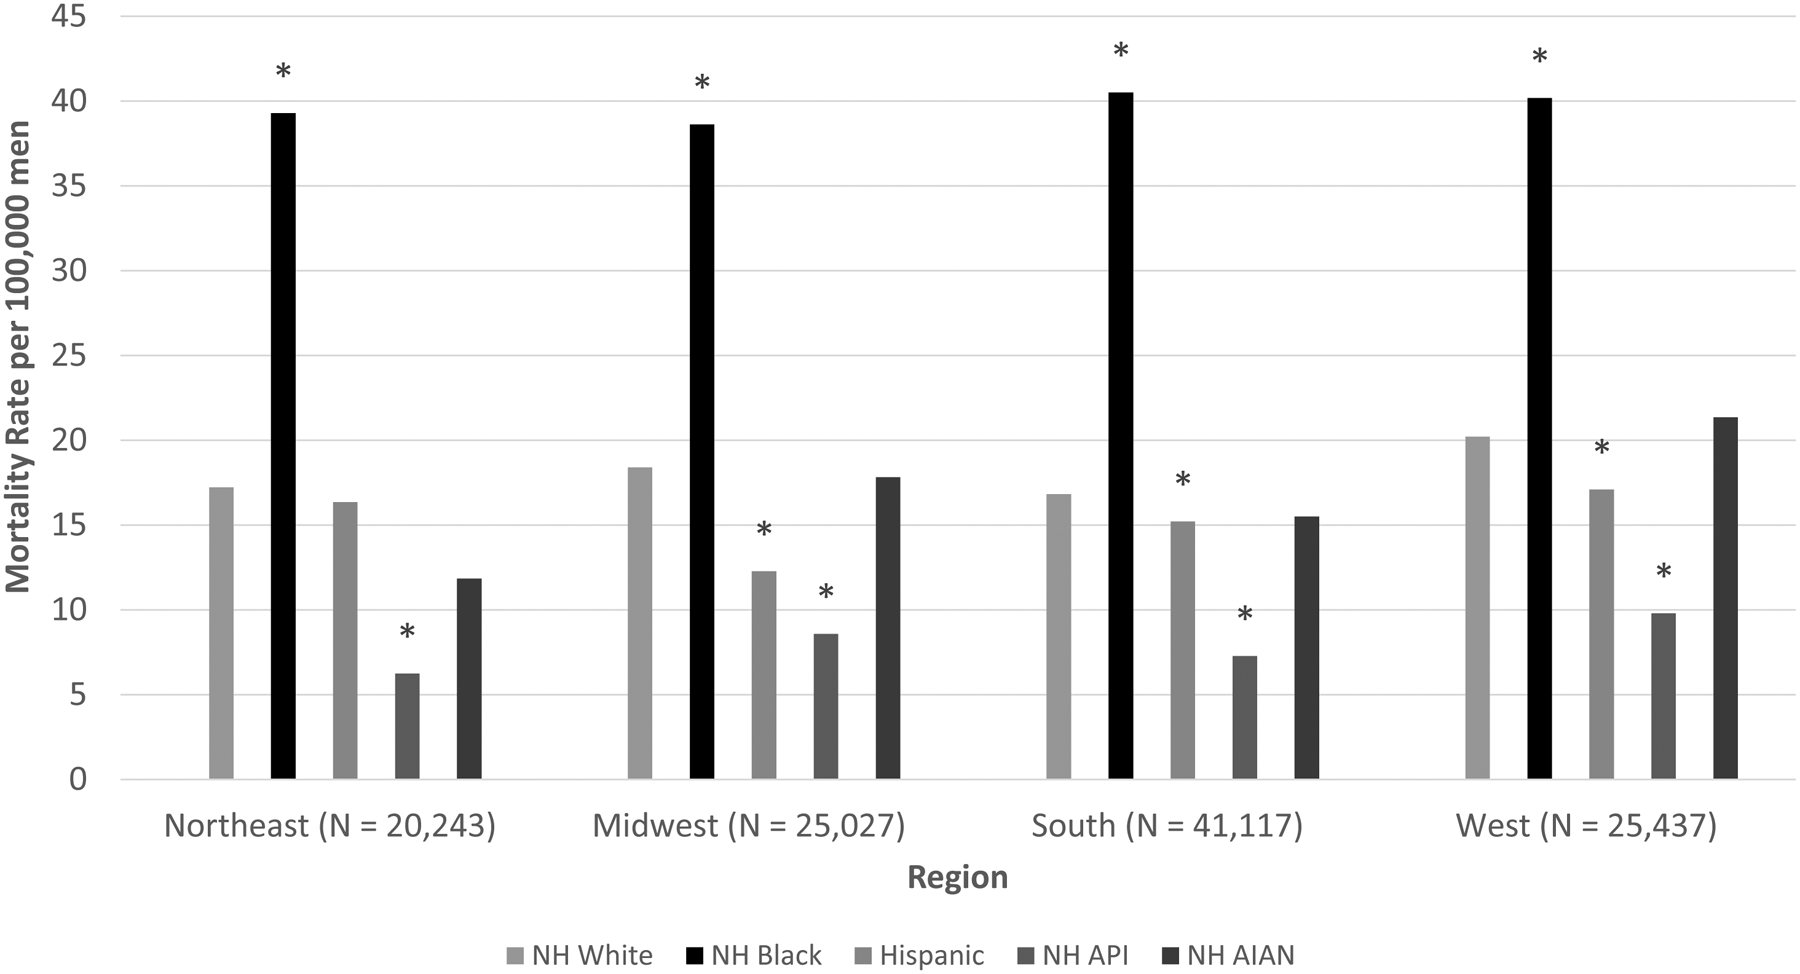
Age-adjusted Prostate Cancer Mortality Rates by Region and Race/Ethnicity, 2012–2015
NH = Non-Hispanic; API = Asian/Pacific Islander; AIAN = American Indian/Alaska Native
Asterisk(*) indicates statistically significant difference (P < 0.05) from Non-Hispanic white estimate.
Rates are per 100,000 men and are age-adjusted to the 2000 U.S. standard population (19 age groups – Census P25–1130).
Surveillance, Epidemiology, and End Results (SEER) Program (www.seer.cancer.gov) SEER*Stat Database: Mortality - All COD, Aggregated With State, Total U.S. (1969–2015) <Katrina/Rita Population Adjustment>, National Cancer Institute, DCCPS, Surveillance Research Program, released December 2017. Underlying mortality data provided by NCHS (www.cdc.gov/nchs)