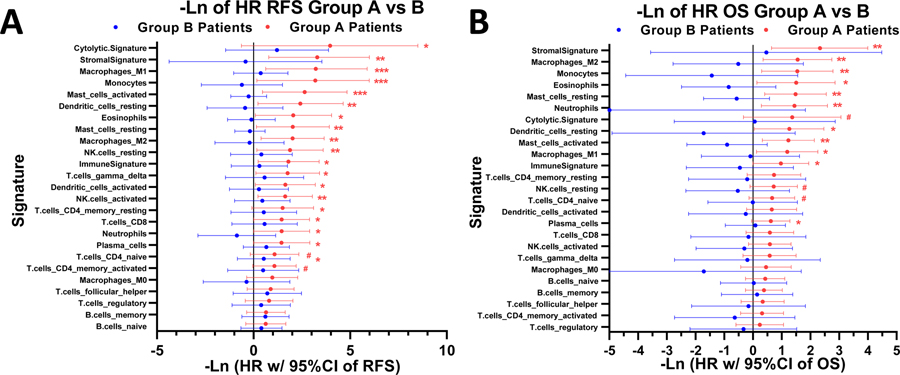
Figure 2. Gene Signatures Prognosticate Favorable Patient Survival in hu14.18-IL2 Treated Tumors, but Not in Group-B (Untreated) Tumors.
Tree plots of the 25 immunologic signatures consistently demonstrated favorable hazard ratios for RFS and OS. (A) For Group A patients, ten (40%) of these signatures showed statistically significant favorable hazard ratios (HRs) of RFS (and ten others showed a trend, 0.01< p ≤ 0.1) but none were significant (or showed a trend) for Group B patients. (B) For Group A patients six (24%) of these signatures showed statistically significantly favorable HRs of OS (and eight others showed a trend, 0.01< p ≤ 0.1), but none were significant (or showed a trend) for Group B patients. Hazard ratios are –Ln (natural log) transformed such that a point estimate of 1.0 denotes a HR of 0.368 and a point estimate of −1.0 denotes a HR of 2.72, thus points plotted to the right of 0.0 indicate favorable outcome and those to the left indicate unfavorable outcome. Legend: *** = p-value <0.001; ** = p-value <0.01, * = p-value <0.05, # = p-value <0.1. The p-values are from the likelihood ratio test (it performs better when sample size is small), whereas the 95% confidence intervals are based on the Wald test.

