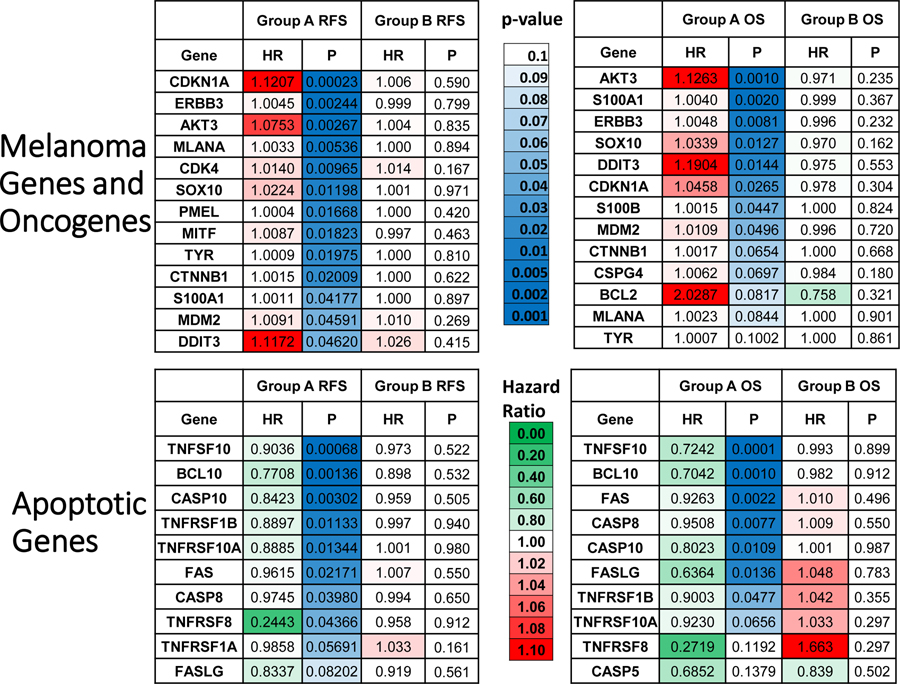
Figure 4. Expression of Melanoma Markers and Oncogenes Portends Unfavorable RFS and OS in Group A but not Groups B. Expression of Apoptotic Marker Genes Portends Favorable RFS and OS in Group A but not Group B.
Gene expression level relationships between melanoma related (top) and apoptosis related (bottom) expression and RFS and OS are shown in heat map form. Melanoma related genes were selected from molecular markers routinely used in diagnostic anatomic pathology. The green to red legend demonstrates either favorable prognosis (HR <1, green) or unfavorable prognosis (HR >1, red), respectively. The blue coloring represents level of significance starting with light blue at p=0.10 and becoming deeper blue with increasing significance. These melanoma and apoptotic parameters tend to prognosticate unfavorable or favorable survival, respectively, in Group A more than they do in Group B.

