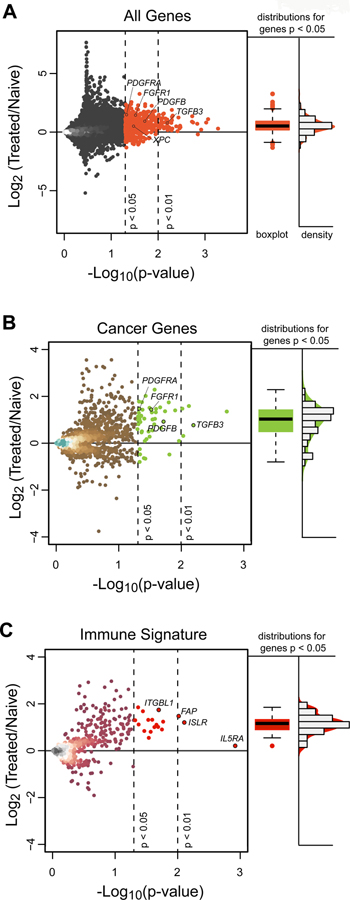
Figure 5. IC Treatment reveals a Predominance of Increased Rather than Deceased Gene Expression.
(A) Gene expression for individual genes are plotted with Log 2 fold changes from naïve [8 in Group B and 2 untreated (No IC)] patients to 13 Group A hu14.18-IL2 treated patients (y-axis) against significance levels (x-axis). There is a marked preponderance of genes that are significantly increased (upper right quadrant), indicating an overall increase in gene expression of transcripts after treatment with hu14.18-IL2. (B) Gene expression plot for individual cancer-related genes (annotated from the Human Protein Atlas) with Log 2 fold changes from 10 naïve patients to 13 Group A patients demonstrates a preponderance of significantly increased (upper right quadrant), but not decreased, expression of genes in Group A vs. naïve tumors. (C) Gene expression plot for individual ssGSEA CIBERSORT immune genes with Log 2 fold changes from 10 naïve patients to 13 Group-A patients demonstrates a preponderance of significantly increased, but not decreased, expression of genes in Group A vs. naïve tumors. There are 52 genes (at p<0.01) and 610 genes (at p<0.05) that show significant fold difference between treated and hu14.18-IL2 naïve tumors. The vast majority of these were upregulated rather than downregulated. Fold change is Log2 transformed such that a point estimate of 1.0 is denotes a fold change of 2.0 and a point estimate of −1.0 denotes a fold change of 0.5. In A, B, and C, the vertical dotted lines represent p-values of 0.05 and 0.01. The horizontal dotted line represents a ratio of 1.0 for expression of the individual gene in the tumors from 13 Group A patients vs. in the 10 naïve tumors. Immunologic genes were taken from all 645 immunologically related genes that are included in our ssGSEA analysis. For Fig. 5A, 5B and 5C, to the right of the dot plots for gene expression ratio vs. p value are box plots and density histograms of those points that are significant (p<0.01), together with those that have 0.01< p < 0.05.

