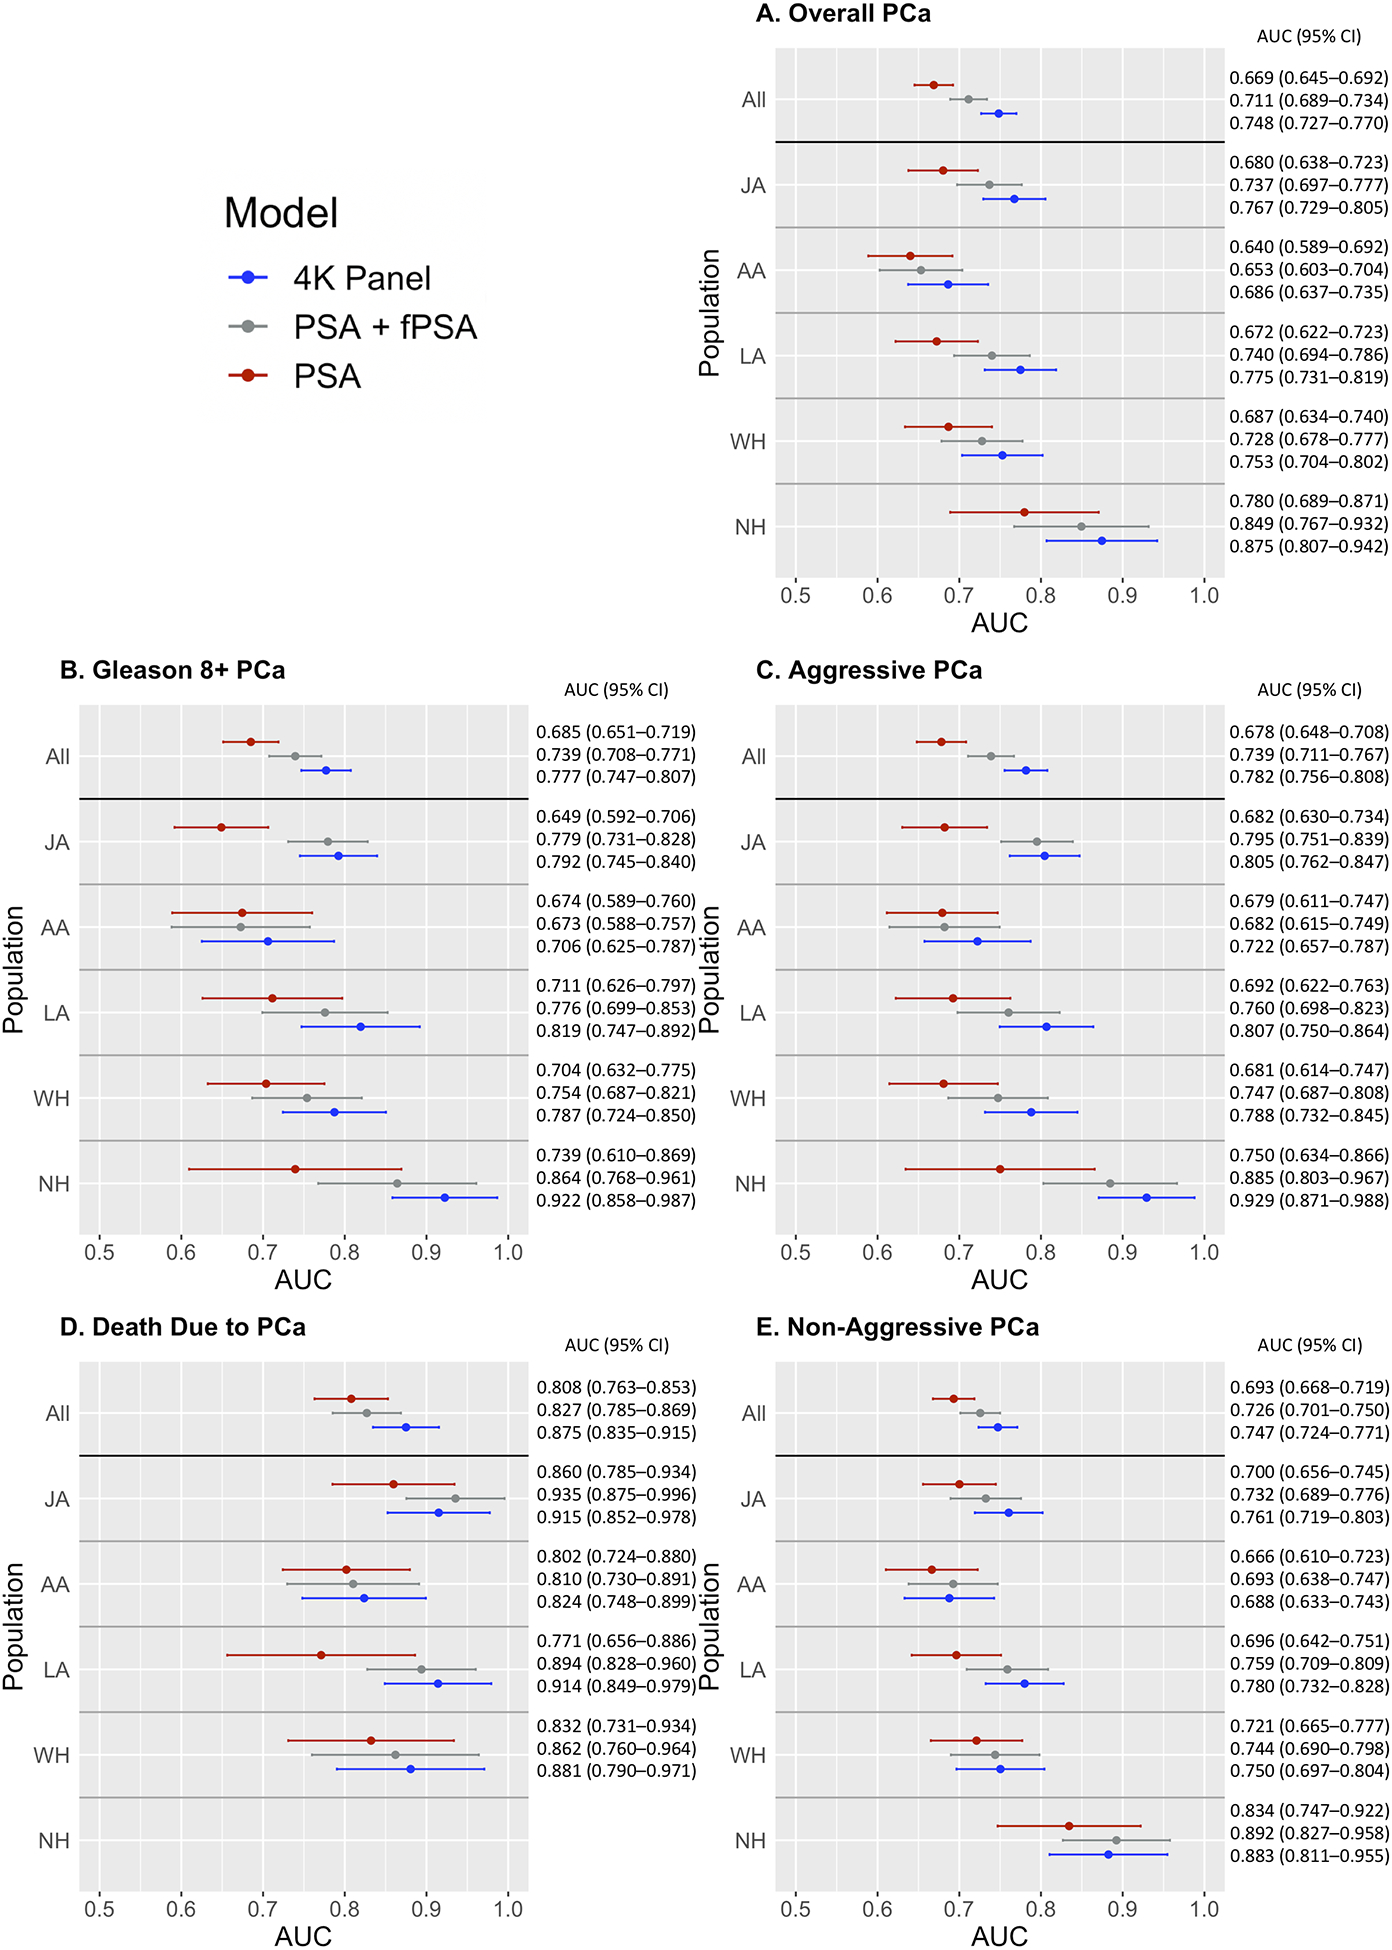
Figure 2.

AUC results by outcome, ethnicity, and model (PSA, PSA + free PSA, 4K Panel) among men with total PSA≥2 ng/mL. A. Overall PCa, B. High Grade PCa, C. Aggressive PCa, D. Death Due to PCa, E. Non-Aggressive PCa. Analyses are adjusted for matching factors (race and ethnicity [“All” analyses only], age at blood draw, area [Hawaii or Los Angeles], hours of fasting, year of collection, and time of collection), body-mass index (BMI) at blood draw, and laboratory batch. The 95% confidence interval for each AUC is indicated by horizontal bars. JA: Japanese, AA: African American, LA: Latino, WH: White, NH: Native Hawaiian.
