
Figure 5: Trametinib treatment decreases leukemia progression in vivo.
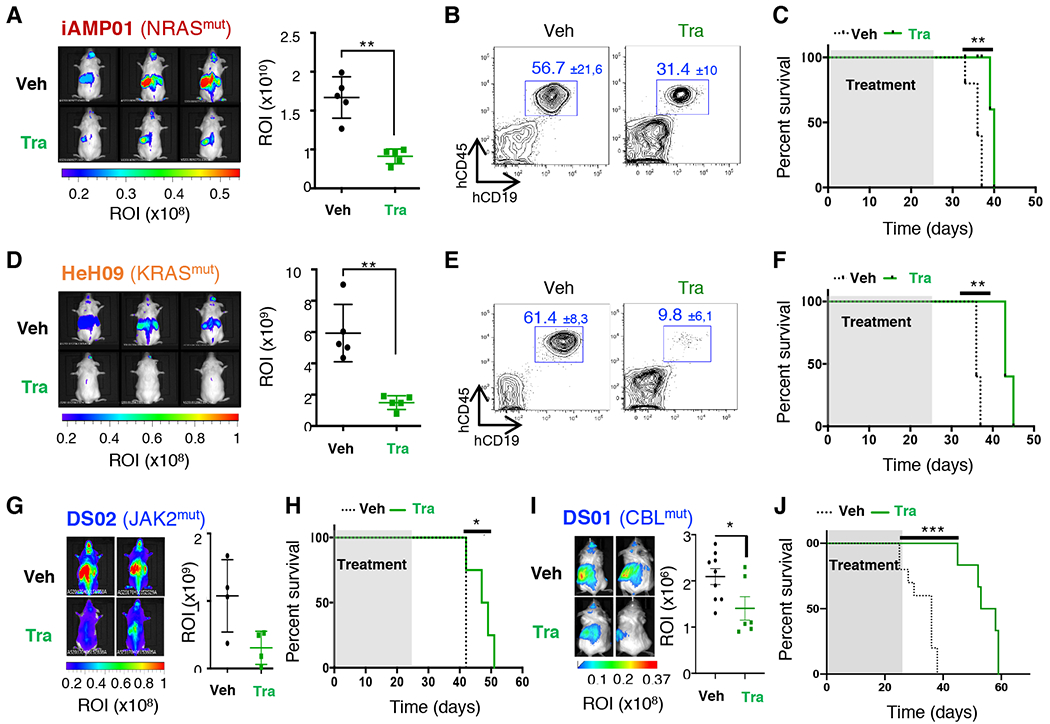
A. Left panel: Whole-body bioluminescence images after 4 weeks of treatment of iAMP01 PDX model. Right Panel: Absolute quantification of ROI (photons/second/surface [p/s/cm2]) between both groups (n=5 mice per group). **p=0.008. B. Proportion of human CD45+CD19+ cells in the peripheral blood at the end of treatment (average percentages ± SD are indicated). C. Survival curves of the iAMP01 PDX model treated with vehicle (black) or Trametinib (1.5 mg/kg, green), (n=5 mice per group), **p=0.003. D-F. Efficacy of Trametinib in the HeH09 PDX model (n=5 mice per group), **p=0.0008 (in D), **p=0.002 (in F). G-H. Efficacy of Trametinib in the DS02 model (n=4 mice per group), *p=0.04. (in H). I-J. Efficacy of Trametinib in the DS01 model (n=6–9 mice per group), *p=0.04 (in I), ***p=0.0003 (in J).