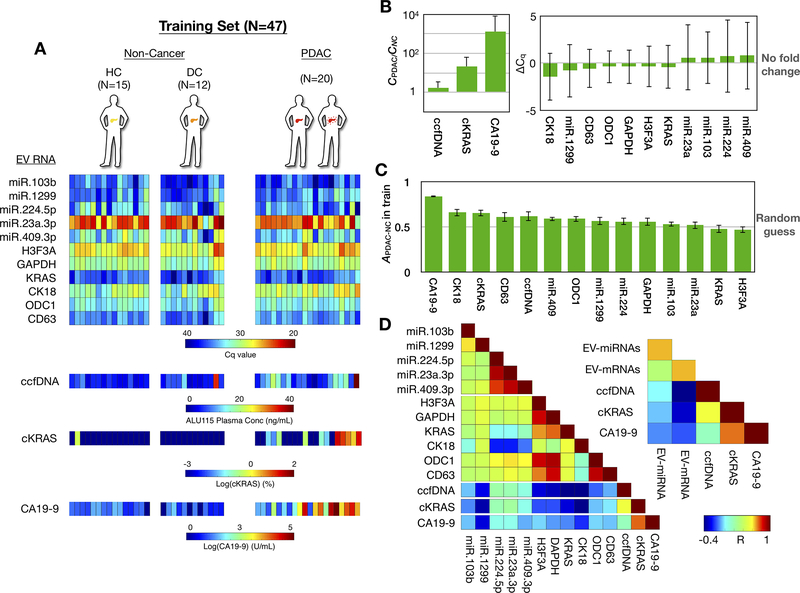
Figure 2. Development of the biomarker panel using the training set.
(A) Heatmap shows values for the 14 circulating biomarkers from each patient in the training set, which included 15 healthy controls, 12 disease controls, and 20 PDAC patients. (B) Fold changes of all biomarkers are plotted comparing PDAC vs. Non-Cancer patients. Error bars are standard deviation. ΔCq is calculated as Cq,PDAC - Cq,NC (C) Accuracy of each individual biomarker for PDAC diagnosis. Clinical threshold of 36 U/mL was used for CA19–9. Other biomarkers’ thresholds were determined by Linear Discriminant Analysis. Error bars are standard error from bootstrapping 10 times from the training set. (D) A colormap shows the Pearson correlation coefficient (R) between each circulating biomarker. The inset colormap shows the average Pearson correlation coefficient among EV-miRNAs (by averaging R from all possible EV-miRNA pairs), EV-mRNAs (by averaging R from all possible EV-mRNA pairs) with the CA19–9, ccfDNA concentration, and KRAS mutation detection in ccfDNA designated ctDNA, for circulating tumor DNA, in the figure).

