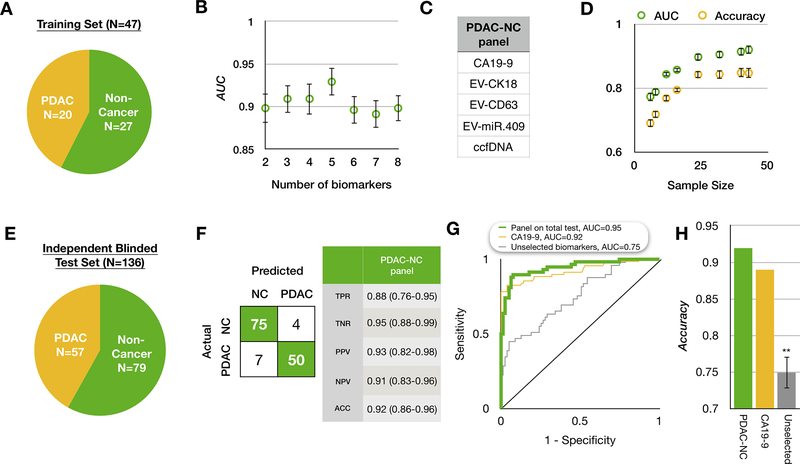
Figure 3. Applying the biomarker panel to distinguish PDAC from non-cancer.
(A) A summary of the patient cohort used to train our platform to classify PDAC vs. Non-PDAC. (B) We selected the panel using least absolute shrinkage and selection operator (LASSO). The best performing panel was selected based on its area under the curve (AUC) using 10-fold cross validation within the training set repeated 5 times. Error bars are standard error. (C) The resulting PDAC vs non-PDAC (PDAC-NC) panel consists of 5 biomarkers. (D) A learning curve generated by bootstrapping 10 times within the training set. Error bars are standard error. (E) A summary of the independent patient cohort used to evaluate the classification of PDAC-NC in a blinded study. (F) The confusion matrix on the blinded test set showing that 75 of 79 non-cancer samples (95%) and 50 of 57 PDAC samples (86%) were correctly identified. TPR: true positive rate; TNR: true negative rate; PPV: positive predictive value; NPV: negative predictive value; (G) Receiver operating characteristic (ROC) curve comparison between the PDAC-NC panel and the best individual biomarker CA19–9, plus a control experiments of unselected biomarkers, where the training set was used to generate a model without using feature selection. (H) Comparison of accuracy of our PDAC-NC panel and the best individual biomarkers, plus the same control experiments described above. Error bars are standard error from bootstrapping 10 times

