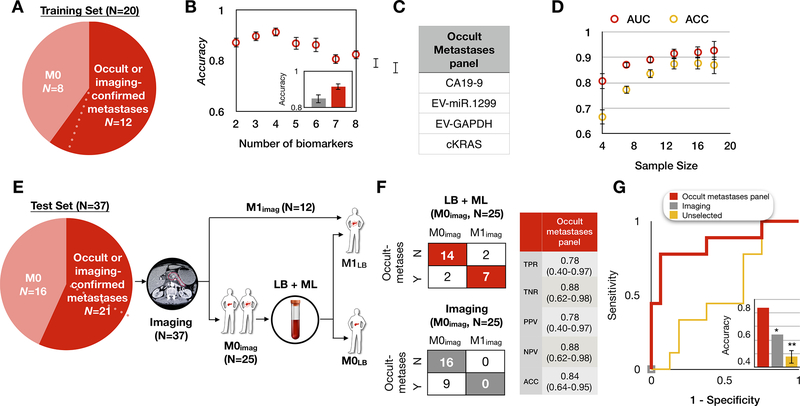
Figure 4. Retraining the model to distinguish metastatic from non-metastatic PDAC.
(A) Patient cohort used to train our platform to classify occult or imaging-confirmed metastatic patients from non-metastatic PDAC patients. Dotted line indicates one PDAC patient who was originally determined by imaging to be M0 but was subsequently determined to have harbored occult metastases due to metastatic outgrowth less than 4 months from blood draw, hence was considered as occult metastases. (B) We selected the panel using least absolute shrinkage and selection operator (LASSO). The best performing panel was selected based on its AUC using 8-fold cross-validation within the training set and repeated 10 times. The inset shows the comparison of the accuracy between our panel (red) and the clinical diagnosis (grey). Error bars are standard error from bootstrapping 10 repeats. (C) The panel for metastatic PDAC detection consists of 4 biomarkers. (D) Learning curve of metastatic PDAC detection generated by bootstrapping N = 10 times within the training set. Error bars represent standard error. (E) Proposed clinical workflow to combine liquid biopsy with imaging for a test set of 37 PDAC patients, including 9 patients who were determined to have a time to metastases of <4 months. Baseline imaging was used to classify patients as either metastatic (M1; N=12, top arm) or no detectable metastases (M0imaging; N=25, bottom arm). For the 25 M0imaging patients, the liquid biopsy panel was then performed, resulting in 2 patient classifications, those called by the model as M1 (occult metastases; top arm) or those called as M0 (M0LB; bottom arm). LB: liquid biopsy; ML: machine learning. (F) Shown are the confusion matrices for the 25 M0imaging PDAC patients by imaging alone (bottom) and our method combining liquid biopsy with imaging (top). Our panel achieved accuracy = 84% with 78% sensitivity and 88% specificity. TPR: true positive rate; TNR: true negative rate; PPV: positive predictive value; NPV: negative predictive value. (G) Receiver operating characteristic (ROC) curve analysis on N = 25 M0imaging PDAC patients in the blinded test set. Inset shows the accuracy comparison between imaging only (grey, accuracy=64%), control experiment using unselected biomarkers (yellow, accuracy=48%), and liquid biopsy (red, accuracy=84%) panel. Error bars are standard error from bootstrapping 10 repeats.

