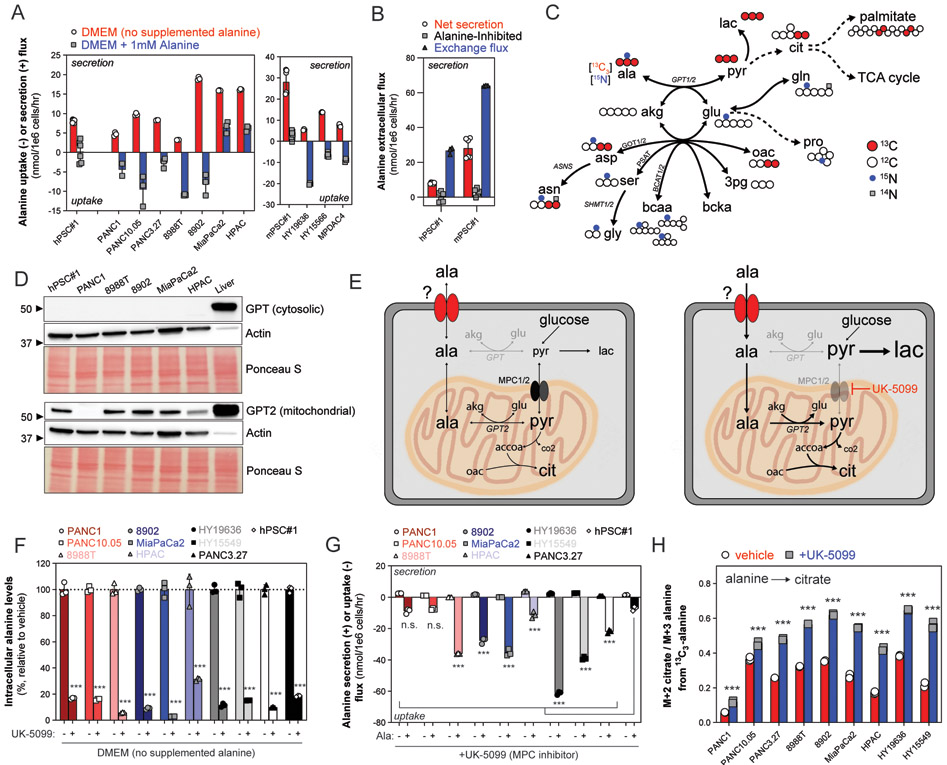
Fig. 1. Compartmentalized alanine metabolism in PDAC.

(A) Alanine uptake and secretion flux in a panel of human and mouse PDAC and PSC lines cultured in DMEM or DMEM supplemented with 1mM L-alanine. Extracellular accumulation (+, secretion) or depletion (−, uptake) was measured in conditioned media over 24-72 hours and normalized to the viable cell density over the time course. Error bars depict s.d. of ≥3 technical replicate wells from 1-2 independent experiments normalized to growth of surrogate wells. (B) Alanine exchange flux as compared to net secretion flux and substrate-inhibited flux in human and mouse pancreatic stellate cell lines. 13C3-alanine dilution by unlabeled (M+0) alanine was measured over time, and the molar exchange flux was quantified and normalized by viable cell density over 24 hours. Error bars depict s.d. of ≥3 technical replicate wells from 1-2 independent experiments. Data for alanine net secretion and inhibited flux from same experiment as Fig. 1A. (C) Atom transition map summarizing 13C3-alanine and 15N-alanine contributions to PDAC intracellular metabolism in a diverse panel of human and mouse PDAC cell lines. Large, grey circles depict 13C atom transitions through central carbon metabolism; small, black circles depict 15N atom transitions through the transaminase network. Unlabeled (12C, 14N) atoms depicted as white circles. (D) Immunoblot of cytosolic GPT (top) and GPT2 (bottom) in whole cell lysates (30 μg) extracted from hPSC#1, human PDAC cell lines, or normal murine liver (as positive control for both GPT and GPT2). Immunoblot of actin and Ponceau S staining to indicate equal loading between cell lines. Representative immunoblot from three experiments using two independently collected sets of lysates. (E) Diagram depicting compartmentalized alanine utilization and de novo synthesis pathways. (Left panel) In basal conditions, PDAC cells both de novo synthesize alanine in the mitochondria and import cytosolic alanine into the mitochondria for GPT2-dependent utilization. (Right panel) Inhibiting mitochondrial pyruvate transport, and thus de novo alanine synthesis, increases demand for environmental alanine and reveals mechanism to uncouple MPC activity from pyruvate oxidation. (F) Intracellular alanine levels normalized by cell number in panel of PDAC cell lines and hPSC#1 in response to vehicle (DMSO) or UK-5099 (10 μM for human PDAC, 25μM for murine PDAC) in DMEM. Data are represented as percentage relative to vehicle. Error bars depict s.d. of ≥3 technical replicate wells from one independent experiment. (G) Alanine secretion flux and uptake flux in response to MPC inhibition using UK-5099. Extracellular accumulation (+, secretion) or depletion (−, uptake) was measured in conditioned basal media (DMEM, secretion) or alanine-supplemented media (DMEM + 1mM L-alanine, uptake), respectively, over 24 hours and normalized to the viable cell density over the time course. Error bars depict s.d. of ≥3 technical replicate wells from one independent experiment normalized to growth of surrogate wells. (H) Citrate M+2 labeling normalized to alanine labeling (M+3) in PDAC cells in response to vehicle (DMSO) or MPC inhibition using UK-5099 cultured in DMEM supplemented with 1mM 13C3-alanine. Error bars depict s.d. of three technical replicates. Significance determined with two-way ANOVA using Sidak’s multiple comparisons test in F, G, and H. n.s. p≥0.05, *** p<0.001.
