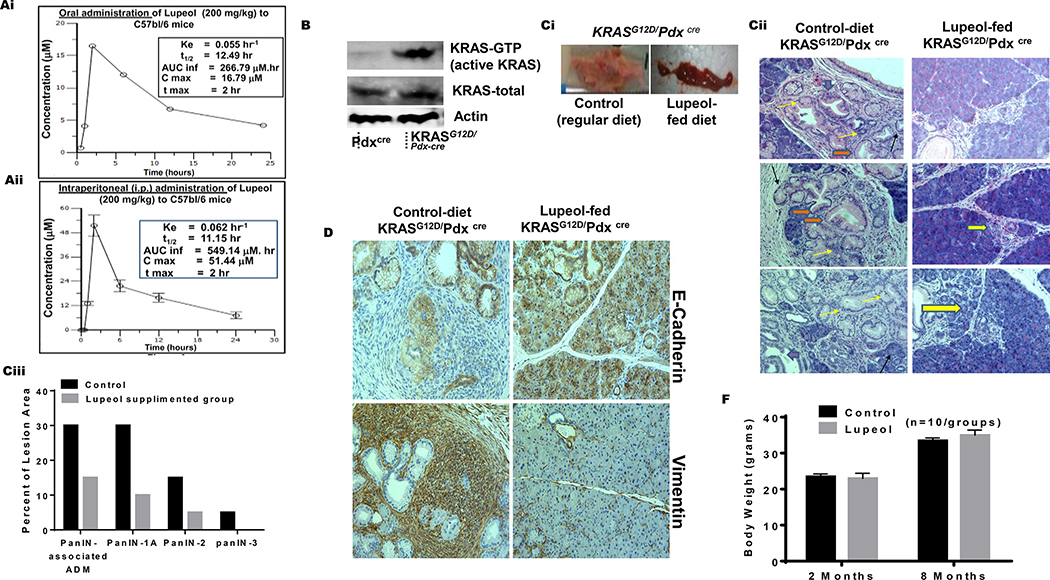
Figure 4: Lupeol inhibits development of PanIN in KRASG12D/Pdxcre transgenic mice.
(Ai-ii) Graphs show 24 h pharmacokinetic profile of Lupeol in mice following 200 mg/kg oral and intraperitoneal administration. Inset in Figures Ai-ii shows pharmacokinetic profile (Cmax = Maximum plasma concentration; Tmax = Time to maximum concentration; AUClast = Area under the curve from time 0 to 24 hrs. AUCinf = Area under the curve from time 0 to infinity). (B) immunoblot image shows the pancreatic KRAS-GTP levels in Pdxcre and KRASG12D/Pdx-cre mice (Ci) Picto-micrographs show the pancreatic morphology in control and Lupeol-fed KRASG12D/Pdxcre mice. (Cii) Representative H&E-stained images of pancreatic acinar-to-ductal metaplasia from a placebo and Lupeol-fed KRASG12D/Pdx-cre mice at 8 months of age. (Ciii) Histogram shows the quantification of mPanIN 1A mPanIN 2A and mPanIN 3 lesions in KRASG12D/Pdxcre control and Lupeol-fed mice (D) Pictures show the EMT phenotype markers E-cadherin (epithelial) and vimentin (mesenchymal) in pancreatic tissues of control and Lupeol-fed mice. (F) Histogram shows the effect of Lupeol treatment on the body weight in mice.

