
Figure 3. Neutrophil-to-macrophage switch in the tumor microenvironment of HDAC5 escapers.
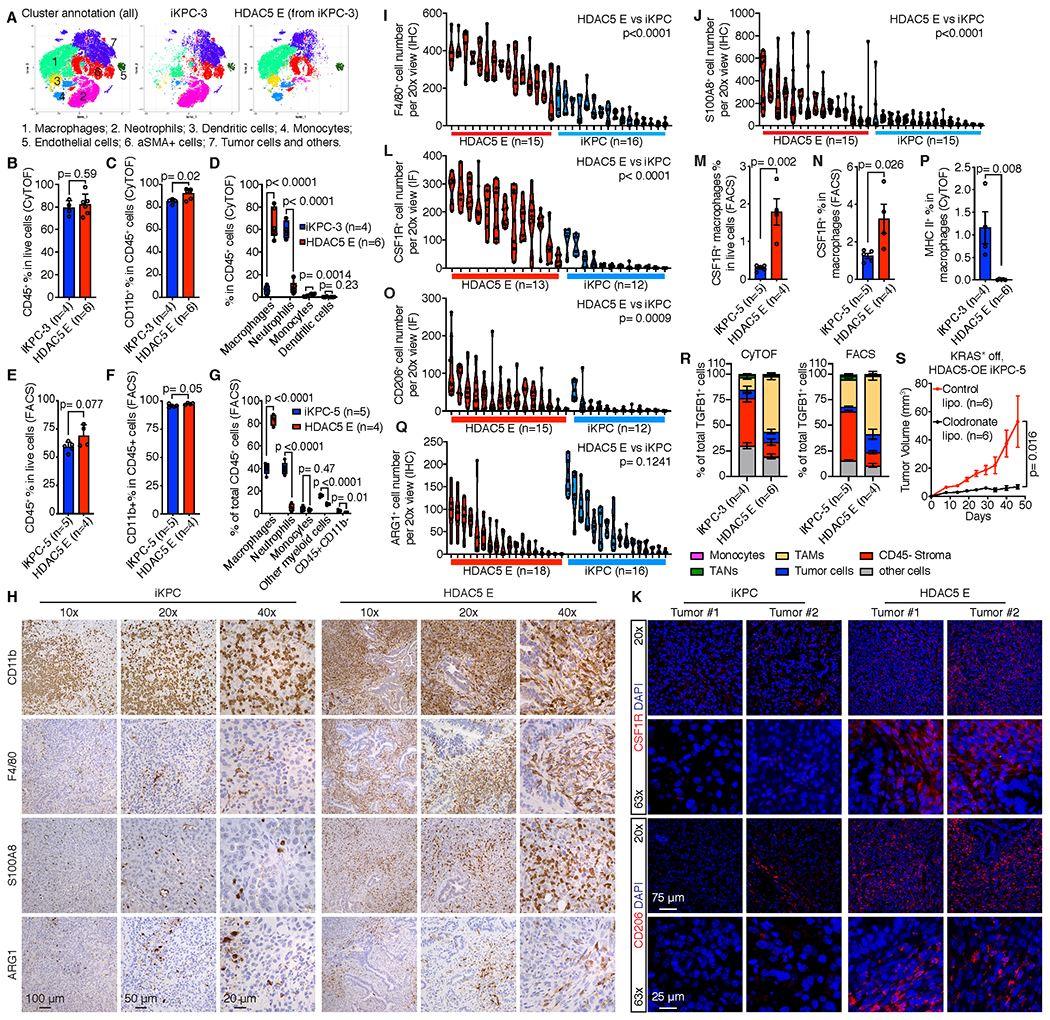
A, Phenographs display cell type annotations based on specific markers and distributions comparing iKPC-3 primary tumors (n=4) and HDAC5 escapers (n=6) derived from subcutaneous allografts in nude mice by CyTOF analysis. B-D, Percentage of infiltrated immune cells (CD45+) in all live cells (B), infiltrated myeloid cells (CD45+CD11b+) in immune cells (CD45+) (C) and myeloid cell populations in total immune cells (D) in iKPC-3 primary tumors and HDAC5 escapers derived from subcutaneous allografts in nude mice by CyTOF analysis. E-G, Percentage of infiltrated immune cells in all live cells (E), myeloid cells in all immune cells (F) and different immune cell populations in total immune cells (G) in iKPC-5 tumors (n=5) and HDAC5 escapers (n=4) derived from orthotopic allografts in nude mice by FACS analysis. H, Representative IHC staining of CD11b, F4/80, S100A8 and ARG1 in an iKPC primary tumor and an HDAC5 escaper. I, J and Q, Quantification of F4/80+ (I), S100A8+ (J) and ARG1+ (Q) cell numbers after IHC staining in iKPC primary tumors and HDAC5 escapers. Different columns indicate different tumors. Each circle dot indicates the cell number with positive staining in one 20x view. At least 5 different 20x views were counted for each tumor by ImageJ. K, Immunofluorescence (IF) staining of CSF1R and CD206 in iKPC tumors and HDAC5 escapers. L and O, Quantification of CSF1R+ (L) and CD206+ (O) cell numbers after IF staining in iKPC primary tumors and HDAC5 escapers. Different columns indicate different tumors. Each circle dot indicates the cell number with positive staining in one 20x view. At least 5 different 20x views were counted for each tumor by ImageJ. M-N, Percentage of CSF1R+ macrophages in all live cells (M) and in macrophages (N) comparing iKPC tumors and HDAC5 escapers by FACS analysis. P, Percentage of MHC II-positive cells in macrophages comparing iKPC tumors and HDAC5 escapers by CyTOF analysis. R, The cell type distributions of total TGFB-expressing cells in iKPC-5 primary tumors and HDAC5 escapers by CyTOF analysis (left) and in iKPC-3 primary tumors and HDAC5 escapers by FACS (right). S, Deletion of macrophages by chlodronate liposome impaired HDAC5-driven bypass of KRAS* dependency in iKPC cell transplanted model in nude mice (n = 6). For B-G and I-K and M-S, data are represented as mean ± SEM; two-tailed unpaired t tests were performed to calculate the p values.