
Figure 5. HDAC5 regulates expression of macrophage-recruiting chemokines through Socs3.
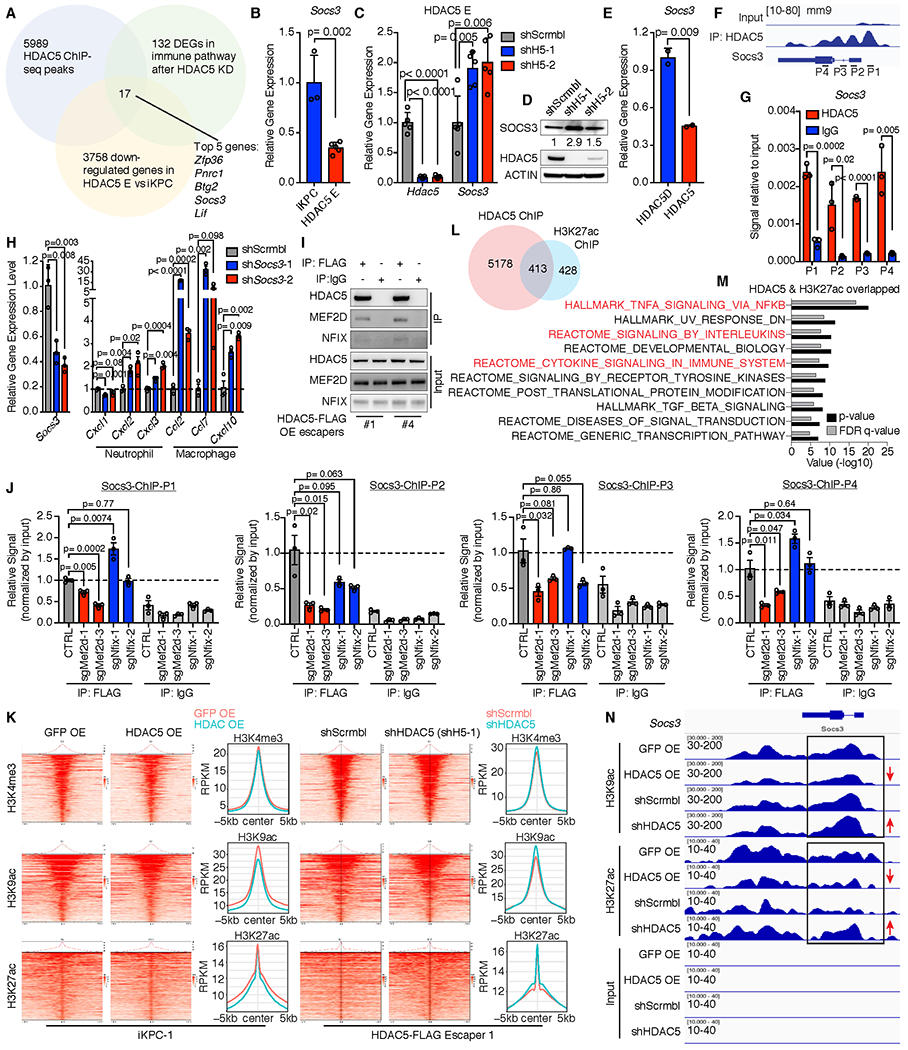
A, Exploration of HDAC5 targets by overlapping 3 profiling datasets: 5589 HDAC5 binding genes from ChIP-seq data, 131 differentially expressed genes (DEGs) in immune pathways after knockdown of HDAC5 comparing to scramble control in HDAC5-driven escaper cells, and 3758 downregulated genes in HDAC5-driven escaper cells comparing to iKPC cells. Seventeen candidate genes were filtered out and ranked by p-values in the 2 RNA-seq datasets from low to high. Top 5 candidates are represented. B, Comparison of Socs3 expression in iKPC cells and HDAC5-driven escaper cells. C and D, Upregulation of Socs3 expression after knockdown of HDAC5 in HDAC5-driven escapers at mRNA level (C) and protein level (D). E, Comparison of Socs3 expression in iKPC cells overexpressing HDAC5D and HDAC5. F, Binding sites of HDAC5 on Socs3 promoter and gene body region from ChIP-seq data. P1-P4 are primers designed for ChIP-q-PCR validation. G, ChIP-q-PCR validation of the binding of HDAC5 on Socs3 promoter and gene body regions. H, Gene expression of neutrophil- and macrophage-attracted chemokines after knockdown of Socs3 in iKPC cells. I, Validation of interactions between HDAC5 and NFIX or MEF2D by co-IP/WB analysis. J, HDAC5-ChIP-q-PCR analysis of HDAC5 escaper cells with scramble control and with knockdown of Nfix or Mef2d. Data are represented as mean ± SEM, and two-tailed unpaired t tests were performed to calculate the p values. K, Heatmaps of overall peak locations relative to the TSS for H3K4me3, H3K9ac and H3K27ac in GFP-OE and HDAC5-OE iKPC-1 samples as well as in HDAC5-FLAG escaper #1 cells with scramble control and HDAC5 knockdown (shH5-1). L, Schematic display of the overlapped genes that are bound by HDAC5 and marked by H3K27ac. M, GSEA analysis of the overlapped genes that are bound by HDAC5 and marked by H3K27ac. N, Histone acetylation marker status at Socs3 loci in the two comparison groups. For B, C, E, G and H, data are represented as mean ± SD, and two-tailed unpaired t tests were performed to calculate the p values.