
Figure 7. HDAC5 promotes KRAS* bypass and the therapeutic benefits of co-targeting HDAC5-CCL2/CCR2-TGFβ/SMAD4 axis and KRAS* signaling in syngeneic PDAC model.
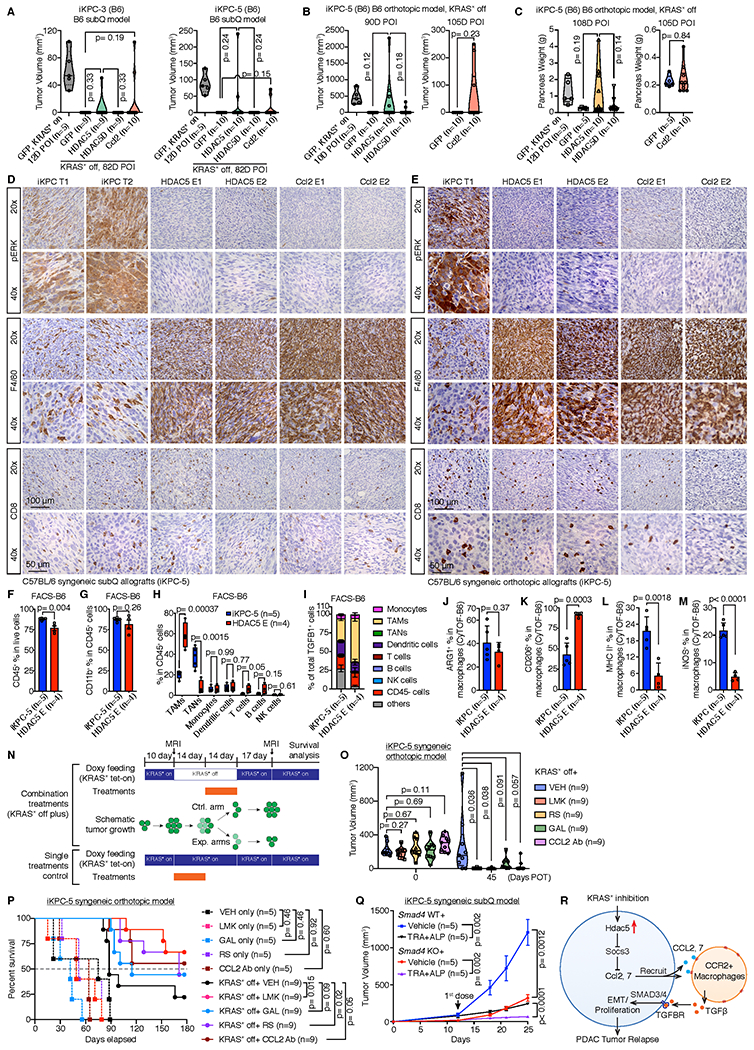
A, HDAC5 and Ccl2 promoted two different iKPC cells to bypass KRAS* dependency in subcutaneous allograft models in C57BL/6 syngeneic mice. B, Tumor volume analysis of C57BL/6 mice orthotopically transplanted with GFP-, HDAC5- or HDAC5D-OE iKPC-5 cells. Mice were given normal water to extinct KRAS* expression. MRI imaging was performed to measure the tumor size at indicated time points. C, Pancreas weight analysis from C57BL/6 mice orthotopically transplanted with GFP-, HDAC5- or HDAC5D-OE iKPC-5 cells at day 108 after KRAS* extinction. D and E, Characterization of HDAC5 escapers and Ccl2 escapers generated in subcutaneous (D) and orthotopic (E) allograft models in C57BL/6 mice by IHC staining of pERK, F4/80 and CD8. The iKPC-5 tumors were used as control. F-H, FACS analysis of iKPC-5 primary tumors (n=5) and HDAC5 escapers (n=4) from orthotopic allograft models in C57BL/6 mice, including quantification of total immune cells (F), total myeloid cells (G), and analysis of immune cell subtypes (H). I, Quantification of cell type distributions in total TGFβ high cells derived from iKPC-5 primary tumors (n=5) and HDAC5 escapers (n=4) from orthotopic allograft models in C57BL/6 mice by FACS analysis. J-M, Percentages of ARG1+ (J), CD206+ (K), MHCII+ (L) and iNOS+ (M) cells in macrophages from iKPC-5 primary tumors and HDAC5 escapers from orthotopic allograft models in C57BL/6 mice by CyTOF analysis. N, The combination treatment strategy with KRAS* inhibition (by removal of DOX feeding) in iKPC-5 orthotopic allograft model in C57BL/6 mice. Cells were orthotopically transplanted in C57BL/6 mice and the mice were given DOX water to activate KRAS* expression. After 10 days, MRI imaging were performed to measure the tumor sizes (Day 0 post-treatment (POT)). Next, DOX was removed to inactivate KRAS* expression for 28 days. Inhibitors targeting the HDAC5-TGFBR-CCL2-CCR2 axis were dosed at day 14 day after KRAS* inactivation. Fourteen days later, all treatments were stopped and mice were given DOX water again to reactivate KRAS* expression. Tumor sizes were measured 45 days POT, and all the mice were kept for survival analysis. O, Comparison of iKPC-5 tumor growth among different treatments with or without KRAS* inhibition: vehicle control (VEH), Class IIa HDAC4/5 inhibitor LMK-235 (LMK), CCR2 inhibitor RS 504393 (RS), TGFBR inhibitor Galunisertib (GAL) and CCL2 neutralizing antibody (CCL2 Ab). P, The Kaplan–Meier survival analysis of different treatment groups in (O). The Gehan-Breslow-Wilcoxon tests were performed to calculate the p values. Q, Knockout of Smad4 in combination with TRA and ALP impaired subcutaneously transplanted iKPC-5 tumor growth in C57BL/6 mice (n=5). R, Schematic graph of the bypass mechanism of KRAS* dependency and therapeutic strategy. For F-M and Q, data are represented as mean ± SEM. For A-C, F-M, O and Q, two-tailed unpaired t tests were performed to calculate the p values.