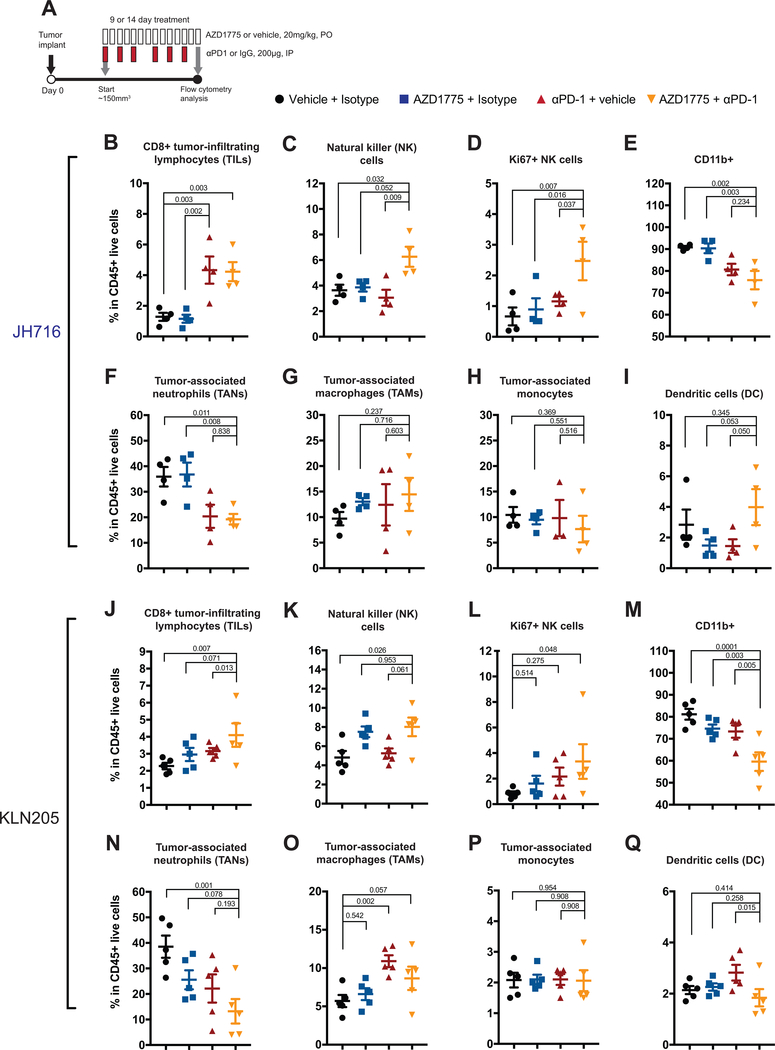
Figure 4. Phenotyping of tumor-associated immune cell populations after treatment in JH716 and KLN205 mouse models.
A. Therapy regimen and flow cytometry analysis time points (PO, per os, QD, once a day, IP, intraperitoneal). Mice were subcutaneously inoculated with JH716 (3×10⁶) and KLN205 (0.5×10⁶) cells and treated with vehicle, AZD1775 (20mg/kg), anti-PD-1(200μg), or combination therapy for 14 and 9 days, respectively. B-F. Quantification by flow cytometry of (B) CD8+ T cells, (C) Natural killer cells (NK), (D) Ki67+ proliferating NK cells, (E) CD11b+ myeloid cells, (F) Tumor associated-neutrophils (TANs; CD11b+/MHCII-/Ly6G+/Ly6Clo), (G) Tumor-associated macrophages (TAM; CD11b+/MHCII+/F4/80+/Ly6C-), (H) Tumor-associated monocytes (CD11b+/MHCII+/F4/80-/Ly6C+), (I) Tumor-associated dendritic cells (CD11b+/MHCII+/F4/80-/Ly6C-/CD11c+), in CD45+ TILs from dissociated JH716 tumors. J-Q. Flow cytometry analysis of dissociated KLN205 tumors. Each data point represents one mouse (n=4–5 mice per group). P values were determined by one-way ANOVA analyses. Data are shown as mean ±SEM.

