
Figure 2. Comparison of nano-aAPC T cell expansion from melanoma patients and healthy donors.
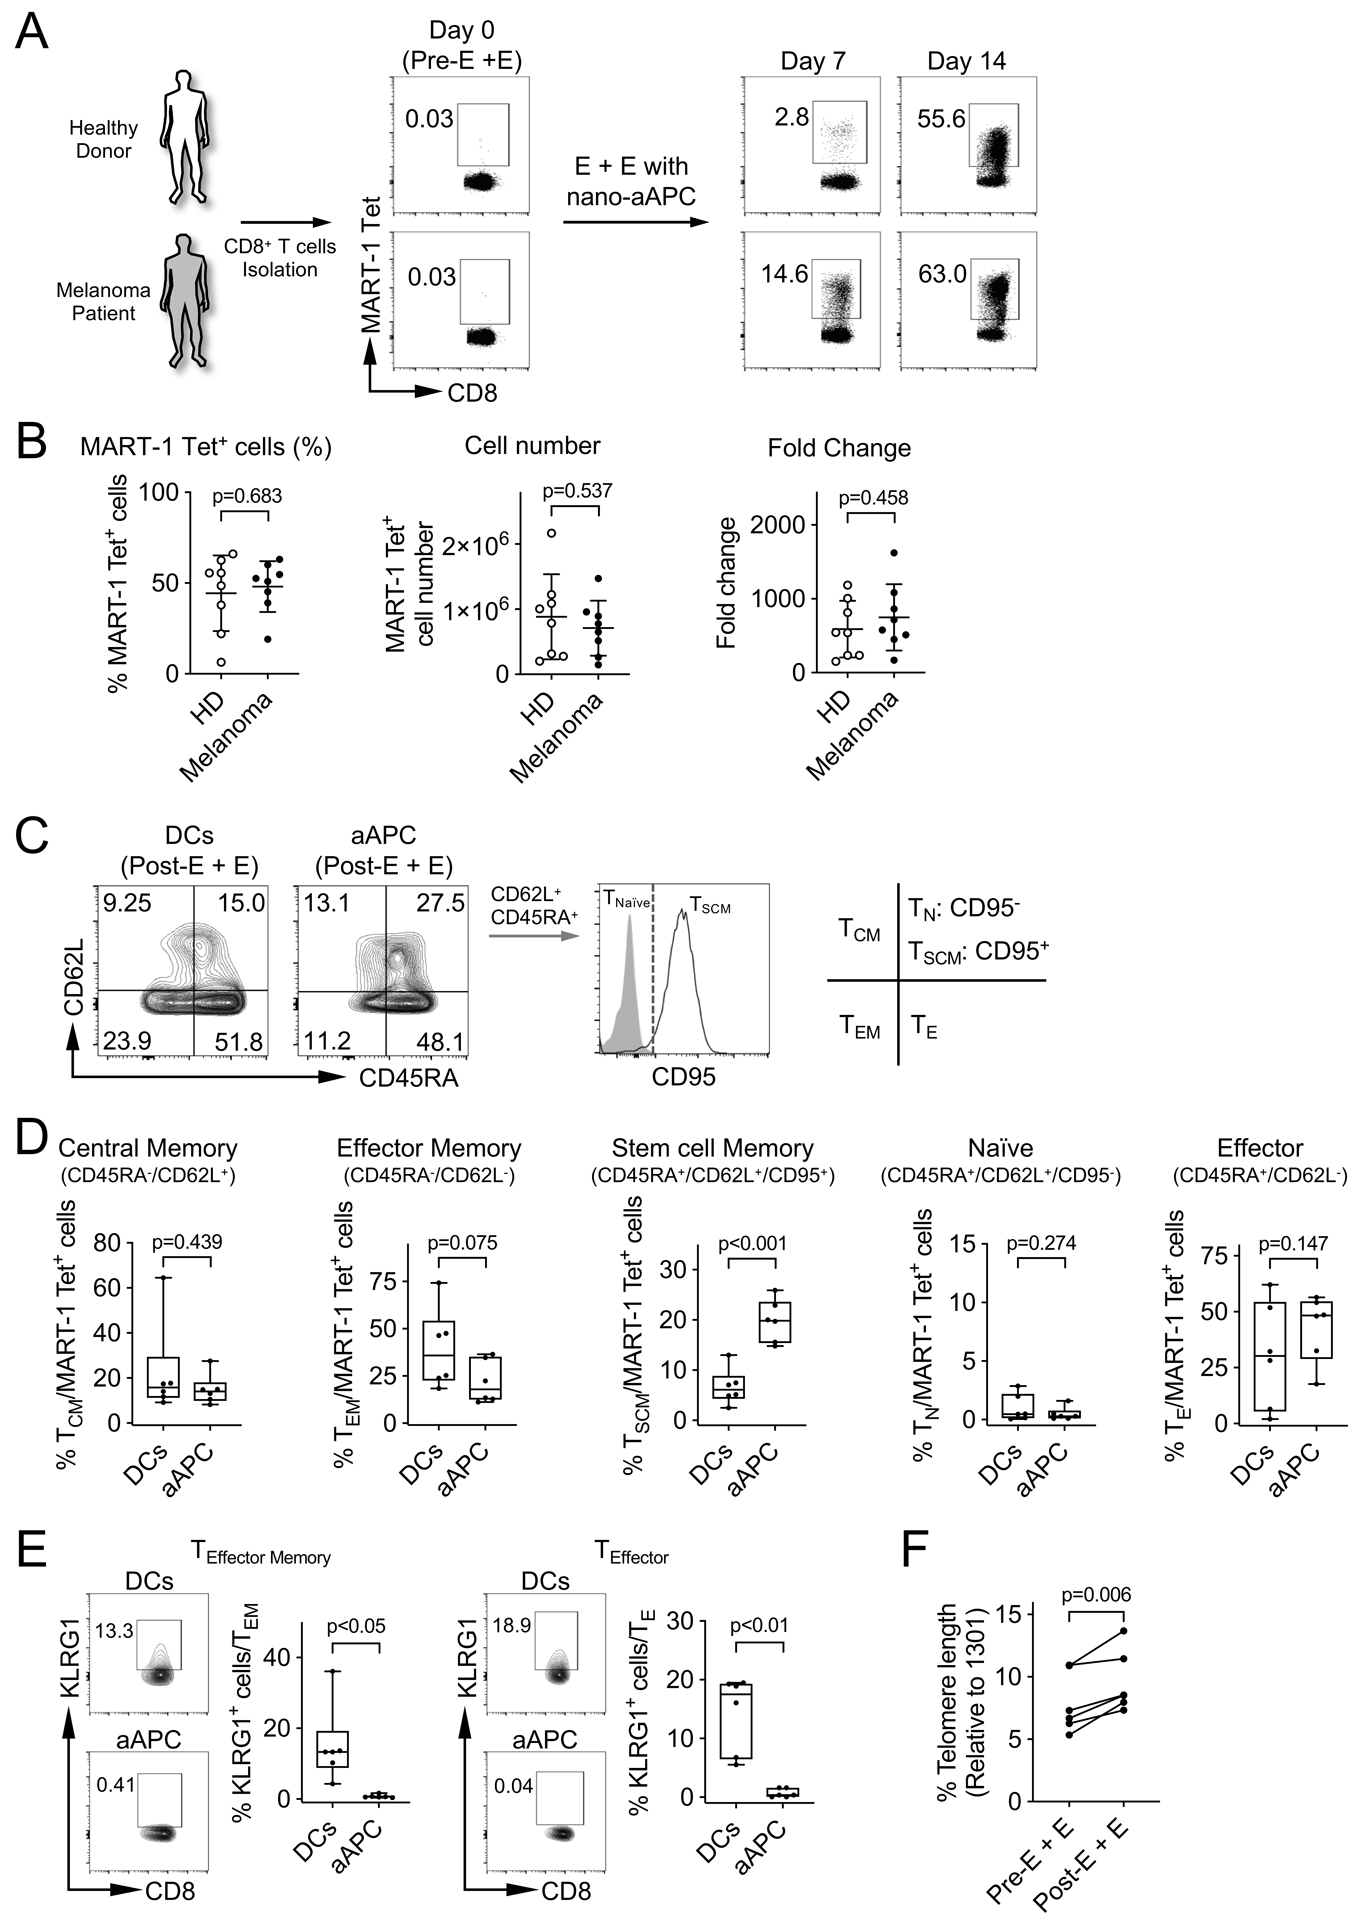
(A) The frequency of MART-1 Tet+ CD8+ T-cells by nano-aAPC expansion on day 0, 7 and 14 from healthy individuals and melanoma patients. Representative flow data of one melanoma patient and one healthy donor were shown. (B) Summary of frequency, fold change and cell number of MART-1 Tet+ CD8+ T-cells expanded by nano-aAPC in 8 healthy donors (HD) and 8 melanoma patients (Melanoma). Significance was assessed by Student’s two-tailed t test. (C) Representative staining of MART-1 Tet+ CD8+ T-cells from melanoma patients expanded by DCs or nano-aAPC for CD45RA, CD62L (L-selectin) and CD95 at day 14. The staining pattern of TSCM and TNaïve was shown. (D) Summary of phenotypes on MART-1 Tet+ CD8+ T-cells expanded by DCs or nano-aAPC from the same melanoma patients (n=6). Phenotypes of T-cells were categorized based on CD45RA, CD62L and CD95 expression into central memory CD45RA−, CD62L+, (TCM), effector memory CD45RA−, CD62L− (TEM), stem cell memory CD45RA+, CD62L+, CD95+ (TSCM), naïve CD45RA+, CD62L+, CD95− (TN), and effector CD45RA+, CD62L− (TE) populations. (E) Expression of KLRG1 on TEffector Memory and TEffector cells of MART-1 Tet+ CD8+ T-cells was analyzed (n=6). (F) Relative telomere length from 6 melanoma patients was analyzed based on those of 1301 cells which has long telomere length. Error bars indicate mean ± SD. Significance was assessed by Student’s two-tailed paired t test.