
Figure 6. MART-1 TCR Repertoires from healthy donors and melanoma patients post expansion with nano-aAPCs.
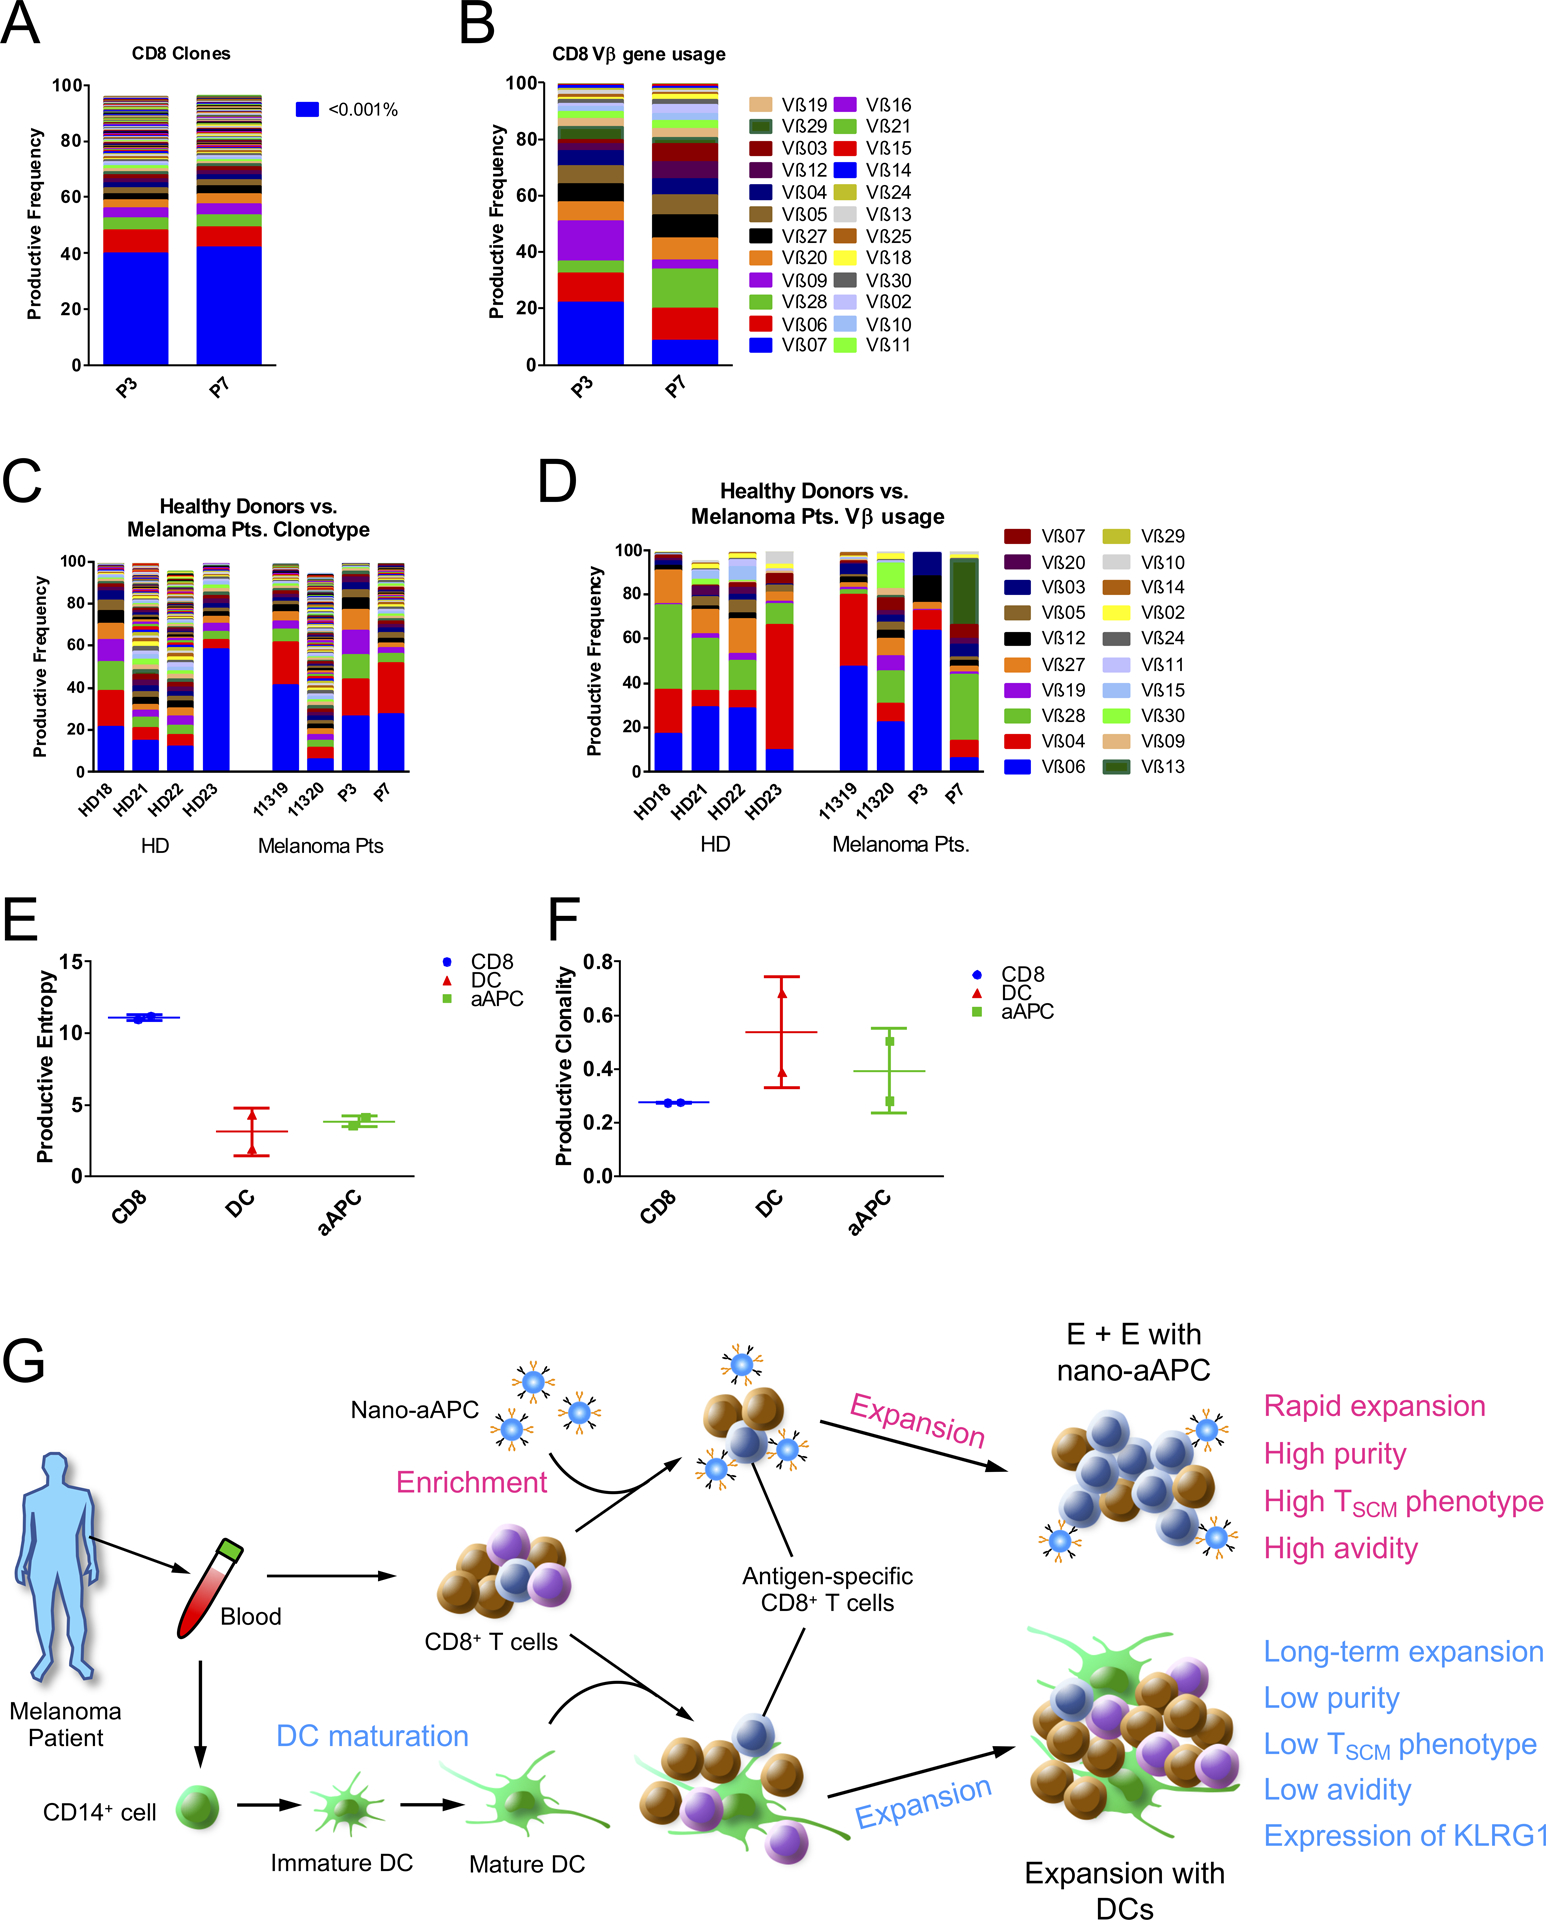
(A) Productive frequency of clones in CD8+ T-cell samples of two patients, with blue representing the sum of all clones with frequencies lower than 0.001%. (B) Vβ gene usage of CD8 samples in two patients prior to DCs or nano-aAPC expansion. (C) Frequency of individual MART-1-specific T cell clones ordered from highest to lowest frequency for healthy donor (HD) vs. melanoma patients. (D) Frequency of each Vβ for MART-1-expanded samples from healthy donors and melanoma patients. (E) Productive Entropy of CD8 samples from two patients compared to their corresponding MART-1 Tet+ CD8+ T-cells expanded by DCs or nano-aAPC. (F) Productive clonality of CD8 samples from two samples compared to their corresponding MART-1 Tet+ CD8+ T-cells expanded by DCs or nano-aAPC. (G) Summary of expansion by nano-aAPC or DCs.